To get the most out of summer sales, shoppers have to think ahead — sometimes way ahead.
That’s because end-of-summer sales are the ideal time to stock up on hot weather items that you’ll use a year from now. “Flip-flops, bathing suits, beach towels, grills, Adirondack chairs — at the end of the season, that’s when you’ll get the best prices of the year,” says Leah Ingram, who writes about saving money on her Real Sophisticated Consumer blog at LeahIngram.com.
“These sales help stores make room for the next seasonal holiday, and most importantly, they help keep consumers engaged with the brand or retailer during off-peak times,” says Katie Hansen, a senior retail and e-commerce analyst at Mintel, a market intelligence agency.
Shoppers are especially hungry for sales because inflation has been straining Americans’ budgets. “Consumers are trying to make the most of their dollars right now,” Hansen adds.
Getty Images
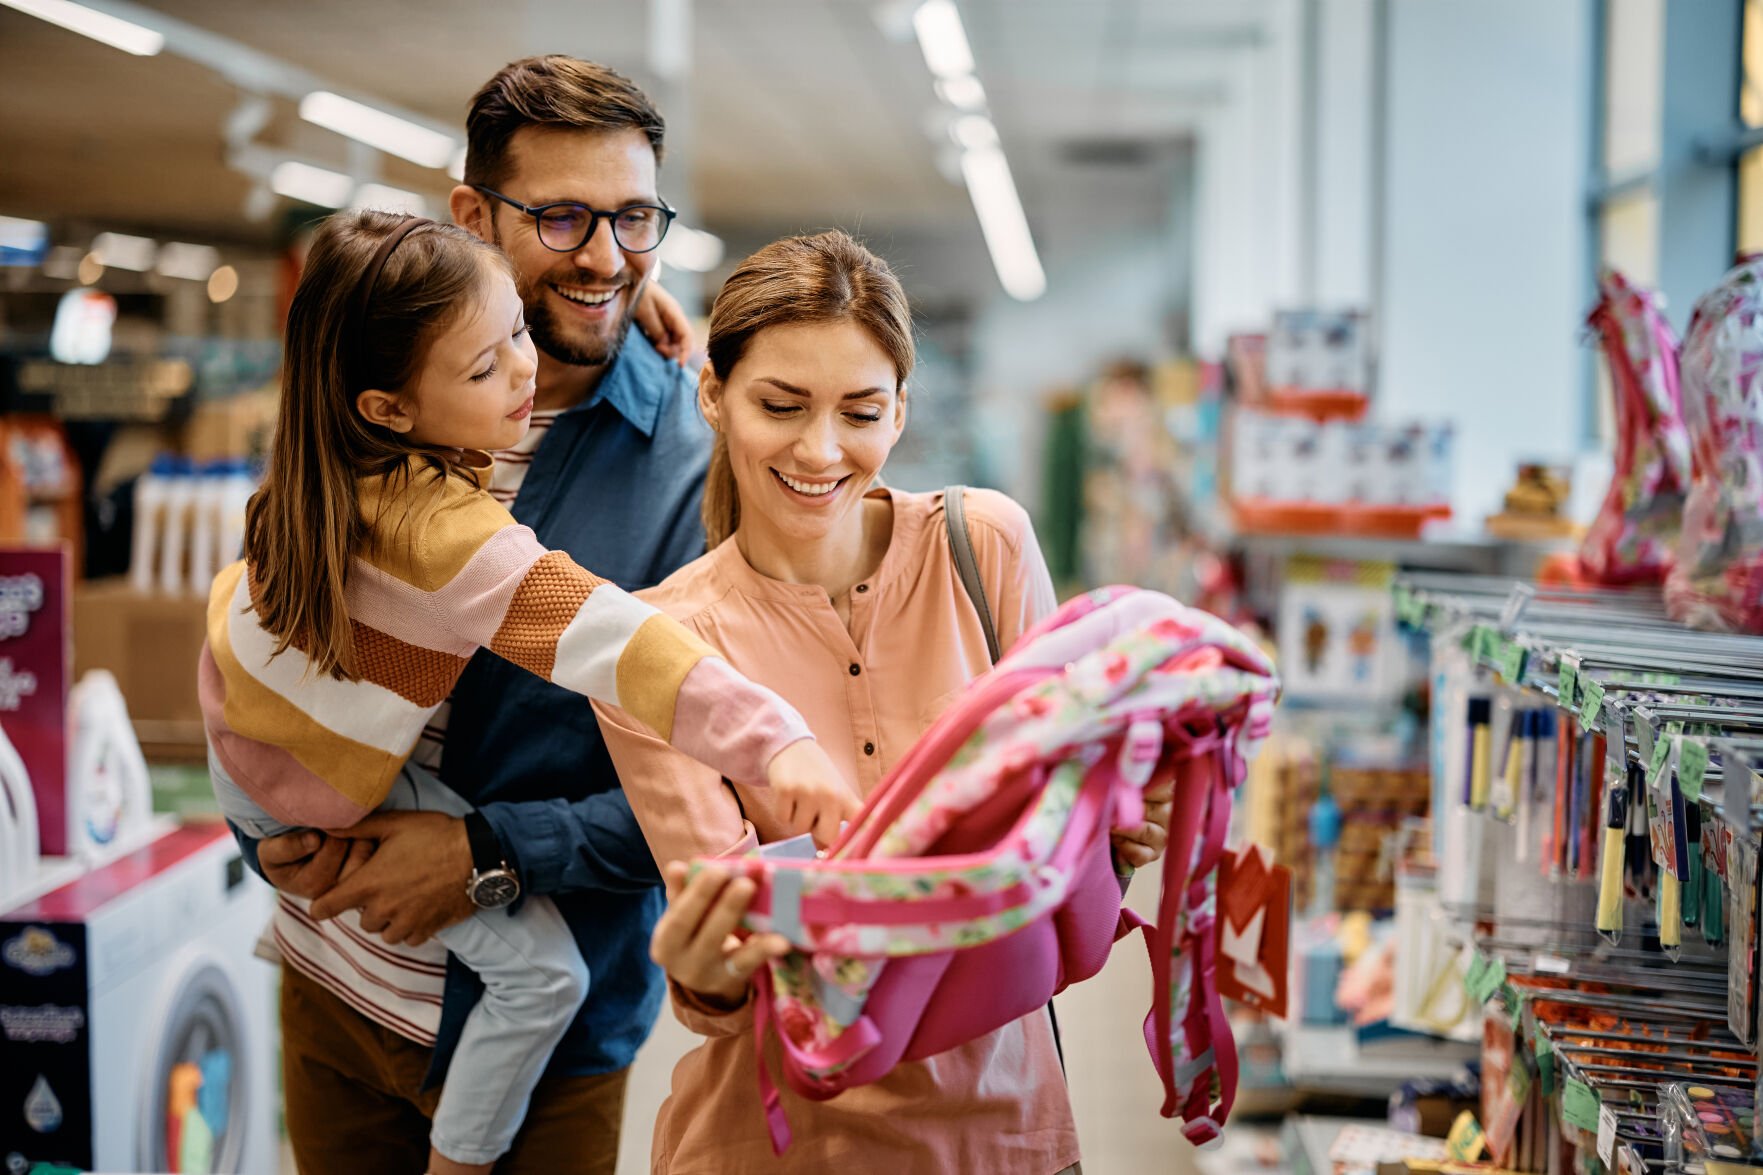
August can be a good time to nab worthy deals on back-to-school supplies.
A plan-ahead strategy can save you hundreds if not thousands of dollars a year. Knowing how to smartly shop late summer and fall sales can bring down the cost of items you’ll use right away, at holiday giving time and next year. Here’s how to get the most out of these sales:
Look for freebies with purchases
To keep shoppers engaged during the slower summer shopping season, retailers often offer additional promotions along with traditional discounts. Those can include “buy one, get one” deals, gift cards or a free gift with a purchase, or even discounts on yearlong memberships, Hansen says.
When comparing prices, consider the whole promotional package.
Don’t delay buying back-to-school supplies
As soon as you receive your supply list from schools, it’s time to go shopping, says Charles Field, CEO of TeacherLists, a national source of verified school supply lists for retailers and parents. “Most retailers roll out back-to-school pricing after July 4, and then it hits its peak through early August,” he says, even though some parents (and kids) might not be ready to think about binders and notebooks quite yet.
Even if you missed this year’s mid-July sales, August could give you another chance at worthy deals, especially if schools in your local district open later.
For some items, wait for October
Last year, major retailers like Amazon and Target held big sales events in October, which allowed shoppers to stock up on gifts months before the holidays arrived. “There’s no reason to think they won’t be doing that again in 2023, so have your ears perked up in October,” Ingram says. If you need big-ticket items such as electronics or appliances, that could be your best chance to buy at a discount.
Similarly, summer clothing goes on sale as fall hits and fall styles even later in the year, so waiting to purchase back-to-school apparel is a smart move, says Samantha Gordon, deals editor at Consumer Reports, a nonprofit consumer research and advocacy organization. “You don’t have to buy everything your kids are going to need right away,” she adds.
Keep watching prices even post-purchase
“One of my favorite tips is after you’ve made the purchase, keep your eye on the item, because you might be able to get a partial refund if it goes on sale next week,” Gordon says.
Retailer policies vary, so you’ll want to check on the details in advance, she adds. And if a retailer doesn’t offer price matching, you might be able to return the full-price item and purchase it again for the discounted price.
Using browser extensions like PayPal Honey, the Camelizer and Rakuten can help ensure you’re buying when prices drop as well as apply any available coupon codes or cash-back opportunities, Ingram says. “You can get cash back on things you need to buy anyway,” she adds.
Spread out holiday expenses
Buying holiday gifts during summer sales or October discounts might sound extreme, but it’s becoming more common for shoppers looking to spread out their expenses and nab the best deals.
“I started to elongate my holiday purchases, starting around Prime Day and other summer sales for my nieces and nephews,” says Christian Piller, co-founder and chief commercial officer of Pollen Returns, a service that handles retail returns. Being more flexible on timing also allows him to make purchases when the biggest sales hit, such as buying a new TV right before the Super Bowl.
Scoring the best deals often means waiting patiently for the moment the price drops, even if that moment comes months before you actually need the item.
___
-
Thinking of buying a new pair of jeans? Breaking down the cost over time might help you decide
icemanphotos // Shutterstock
The travel and tourism industry came to a near halt when the COVID-19 pandemic grounded flights, triggered inflation, and put the world under house arrest.
But as vaccines and health protocols became more available, travelers eager to cure their cabin fever spent more than $1 trillion in 2021—a 64% increase from the previous year—on travel goods and services, according to data from the Bureau of Economic Analysis' annual U.S. Travel and Tourism Satellite Account.
While the spike in spending is still below pre-pandemic levels, it's clear the travel and tourism industry is on the mend when you follow the money.
Stacker used the bureau's data to rank how much tourists spent on lodging, airfare, souvenirs, and other travel-related items in 2021, the latest data available. The bureau measures total spending on goods and services made in the United States and purchased by travelers.
Unsurprisingly, air travel and accommodations top the 19-item list of total travel spending. Shopping and food and beverage services recorded the most significant increases in spending as Americans saw record levels of disposable income.
Because of America's unprecedented inflation—2022 saw a record 40-year increase—Stacker's ranking looked at the data as a percentage of overall cost rather than the actual money spent. Goods and services on the list are ranked by the share of total tourist spending and rounded to the nearest one-tenth of 1%.
The data show the total spending of nonresidents and domestic travelers in the U.S.
-
Thinking of buying a new pair of jeans? Breaking down the cost over time might help you decide
Richard Thornton // Shutterstock
Richard Thornton // Shutterstock
-
-
Thinking of buying a new pair of jeans? Breaking down the cost over time might help you decide
Sundry Photography // Shutterstock
- Share of total travel spending: 0.1%
- Total spent in 2021: $1.2B
- Change from the year before: +5.8%
In 2021, an average of 10,000 passengers rode Greyhound daily—one-fourth of its pre-pandemic ridership. For a 60-mile trip, U.S. bus travelers spent just under $50—$47.94, according to the Fleet Logging study.
-
Thinking of buying a new pair of jeans? Breaking down the cost over time might help you decide
Vladyslav Horoshevych // Shutterstock
- Share of total travel spending: 0.2%
- Total spent in 2021: $1.7B
- Change from the year before: +116.1%
U.S. travelers spend about 6 cents per mile traveling interstate toll roads. Non-interstate toll roads cost an additional 7 cents per mile, according to Uproad, an electronic road payment system. Partially due to leisure travel, the Department of Transportation reported driving in the U.S. increased to 3.23 trillion vehicle miles in 2021, an increase from 2.9 trillion in 2020.
-
-
Thinking of buying a new pair of jeans? Breaking down the cost over time might help you decide
Vlasov Yevhenii // Shutterstock
- Share of total travel spending: 0.2%
- Total spent in 2021: $2.3B
- Change from the year before: +40.3%
A driver shortage created a need for more competitive wages, and coupled with America's elevated gas prices, resulting in higher charter bus prices. Costs to charter a bus depend on the bus' mileage, type, and how long travelers need the bus. Prices range from $300 to $2,500 per day, according to Howmuchisit.org.
-
Thinking of buying a new pair of jeans? Breaking down the cost over time might help you decide
SARYMSAKOV ANDREY // Shutterstock
- Share of total travel spending: 0.3%
- Total spent in 2021: $2.9B
- Change from the year before: +113.4%
Travelers spend an average of $18 per day on airport parking, according to data examined by Bankrate. "U.S. airlines carried 674 million passengers (not seasonally adjusted) in 2021, 82.5% more than in 2020 (369 million)," the Bureau of Transportation Statistics reported.
-
-
Thinking of buying a new pair of jeans? Breaking down the cost over time might help you decide
mikecphoto // Shutterstock
- Share of total travel spending: 0.3%
- Total spent in 2021: $3.1B
- Change from the year before: +83.8%
Tourists in America spend an average of just under $400 per day on sightseeing tours, according to a study based on data from 899 tours from Budget Your Trip. Top domestic destinations include the French Quarter in New Orleans, the Willis Tower in Chicago, and the Statue of Liberty in New York.
-
Thinking of buying a new pair of jeans? Breaking down the cost over time might help you decide
Steve Broer // Shutterstock
- Share of total travel spending: 0.4%
- Total spent in 2021: $4.1B
- Change from the year before: +44.9%
Considered in the industry as the "blueprint" for post-pandemic recovery, more than 175 million people traveled in the U.S. for sport-related reasons in 2021, according to a study by the Sports Events & Tourism Association. The association said that the sports tourism industry's 2021 engagement levels were only 2.6% below 2019's pre-pandemic numbers.
According to the ticket-selling website Seat Geek, the average price for Major League Soccer and Major League Baseball games is about $50; the National Basketball Association and National Hockey League average $90 for tickets. The National Football League has the most expensive average at $151 per ticket.
-
-
Thinking of buying a new pair of jeans? Breaking down the cost over time might help you decide
Mikayel Bartikyan // Shutterstock
Mikayel Bartikyan // Shutterstock
-
Thinking of buying a new pair of jeans? Breaking down the cost over time might help you decide
Phuong D. Nguyen // Shutterstock
- Share of total travel spending: 0.6%
- Total spent in 2021: $6.1B
- Change from the year before: -19.7%
The water transit tourism industry includes cruises, jet skis, sailboats, yachts, ferries, canoes, and rafts. The average daily cost for a Royal Caribbean or Carnival cruise is between $90 to $100 per person, according to Cruzely, a trade website. Norwegian Cruise Line averages about $130 daily per person.
More than 14 million Americans took a cruise vacation in 2019, but the number of domestic cruise passengers dropped to a little more than 2 million two years later, according to Statista.
-
-
Thinking of buying a new pair of jeans? Breaking down the cost over time might help you decide
Sharkshock // Shutterstock
- Share of total travel spending: 0.9%
- Total spent in 2021: $9.1B
- Change from the year before: +228.1%
Buses are the most used mode of public transportation in the U.S., which explains why tourists would use them when vacationing. Buses account for almost half of public transit trips, according to Statista. Local bus fares range from free to just under $3.
-
Thinking of buying a new pair of jeans? Breaking down the cost over time might help you decide
Fusionstudio // Shutterstock
- Share of total travel spending: 1.5%
- Total spent in 2021: $15.5B
- Change from the year before: +14.7%
Moviegoers spend an average of $10.45 on tickets. In 2021, domestic ticket sales exceeded 434 million, according to data from The Numbers, a reference library that studies the movie industry. An analysis by the National Endowment for the Arts found performing-arts venue ticket sales recovering in 2021 after the pandemic shut them down, but not reaching pre-pandemic levels.
-
-
Thinking of buying a new pair of jeans? Breaking down the cost over time might help you decide
Studio Romantic // Shutterstock
- Share of total travel spending: 2.3%
- Total spent in 2021: $24.3B
- Change from the year before: +40.2%
Americans gamble an average of $682 per year, according to PlayUSA, a casino industry website. Two-thirds of Americans have traveled to a different state to gamble at a casino—gamblers travel about 335 miles to casinos.
-
Thinking of buying a new pair of jeans? Breaking down the cost over time might help you decide
IJzendoorn // Shutterstock
- Share of total travel spending: 4.2%
- Total spent in 2021: $44.1B
- Change from the year before: +20.4%
In 2021 customers rented 29.2 million cars, almost double the amount of the previous year, according to statistics website Zippia. During the pandemic, many rental car companies sold off their fleets, causing prices to increase. Zippia's data showed the average rental price for cars and trucks went from $123.18 in December 2017 to $193.75 in December 2021, with the average daily price for a car rental at $81 in December 2021.
-
-
Thinking of buying a new pair of jeans? Breaking down the cost over time might help you decide
Dragana Gordic // Shutterstock
- Share of total travel spending: 6.9%
- Total spent in 2021: $73.7B
- Change from the year before: +93.1%
The national average fixed price for a travel agent is around $50 per person, according to Howmuchisit.org, a data-compilation website. The American Society of Travel Advisors reported that people booked 29% of all travel through travel agencies in 2021, which made it the most significant channel for sales.
-
Thinking of buying a new pair of jeans? Breaking down the cost over time might help you decide
New Africa // Shutterstock
- Share of total travel spending: 12.2%
- Total spent in 2021: $129.8B
- Change from the year before: +49.1%
Tourists in America spent an average of $669 on gas for out-of-town trips, according to ValuePenguin data. The U.S. average cost for gas in 2021 ranged from $2.25 to $3.41 per gallon, according to the Energy Information Administration.
-
-
Thinking of buying a new pair of jeans? Breaking down the cost over time might help you decide
mavo // Shutterstock
- Share of total travel spending: 14.6%
- Total spent in 2021: $155.5B
- Change from the year before: +110.4%
Tourists in America spend $46 per person on food each day when on vacation, according to data examined by personal finance site Bankrate.com. A ValuePenguin study estimates 80% of dining dollars spent during vacations is used in restaurants.
-
Thinking of buying a new pair of jeans? Breaking down the cost over time might help you decide
Rawpixel.com // Shutterstock
- Share of total travel spending: 15.1%
- Total spent in 2021: $160.2B
- Change from the year before: +128.6%
Shopping tourism attracts overseas visitors to the U.S. Fifty-four percent of international visitors to the U.S. rank shopping as one of their top five activities to do, according to the Tourism Academy, a career-development organization. International tourists spent about $206.91 shopping in the U.S. in 2021, according to the website Global Data.
-
-
Thinking of buying a new pair of jeans? Breaking down the cost over time might help you decide
Edvard Nalbantjan // Shutterstock
- Share of total travel spending: 18.0%
- Total spent in 2021: $191.2B
- Change from the year before: +31.9%
The average hotel room sets tourists back $156.43 per night. Airbnb averages $168; hotels from $10 to $40, and RV costs from $30 to $50, according to data compiled by Bankrate.com in 2022.
-
Thinking of buying a new pair of jeans? Breaking down the cost over time might help you decide
OlegRi // Shutterstock
- Share of total travel spending: 18.4%
- Total spent in 2021: $195.1B
- Change from the year before: +64.8%
The average cost of a domestic flight in 2021 was $253.75, according to Hopper's Price Tracker, a $3.50 increase from the previous year. Some 674 million passengers hopped a flight on U.S. airlines in 2021, an 82.5% increase from the previous year, according to the Bureau of Transportation Statistics. Despite the increase in travelers, it didn't reach the pre-pandemic number of 927 million passengers.
Fun fact: The airport with the most expensive airfare in 2022 is the Washington D.C., region's Dulles International Airport, with the average flight costing $494.78.
Story editing by Jeff Inglis. Copy editing by Kristen Wegrzyn. Photo selection by Abigail Renaud.
