An enormous medical bill can trigger a wave of panic, but try to resist.
That startling invoice that arrived in the mail may not be what you wind up paying. Errors or slow insurance payments may have inflated the total. Even if it’s accurate, financial aid or other assistance might help pare it.
Sometimes a simple phone call clears up a problem. Other times, reinforcements are necessary.
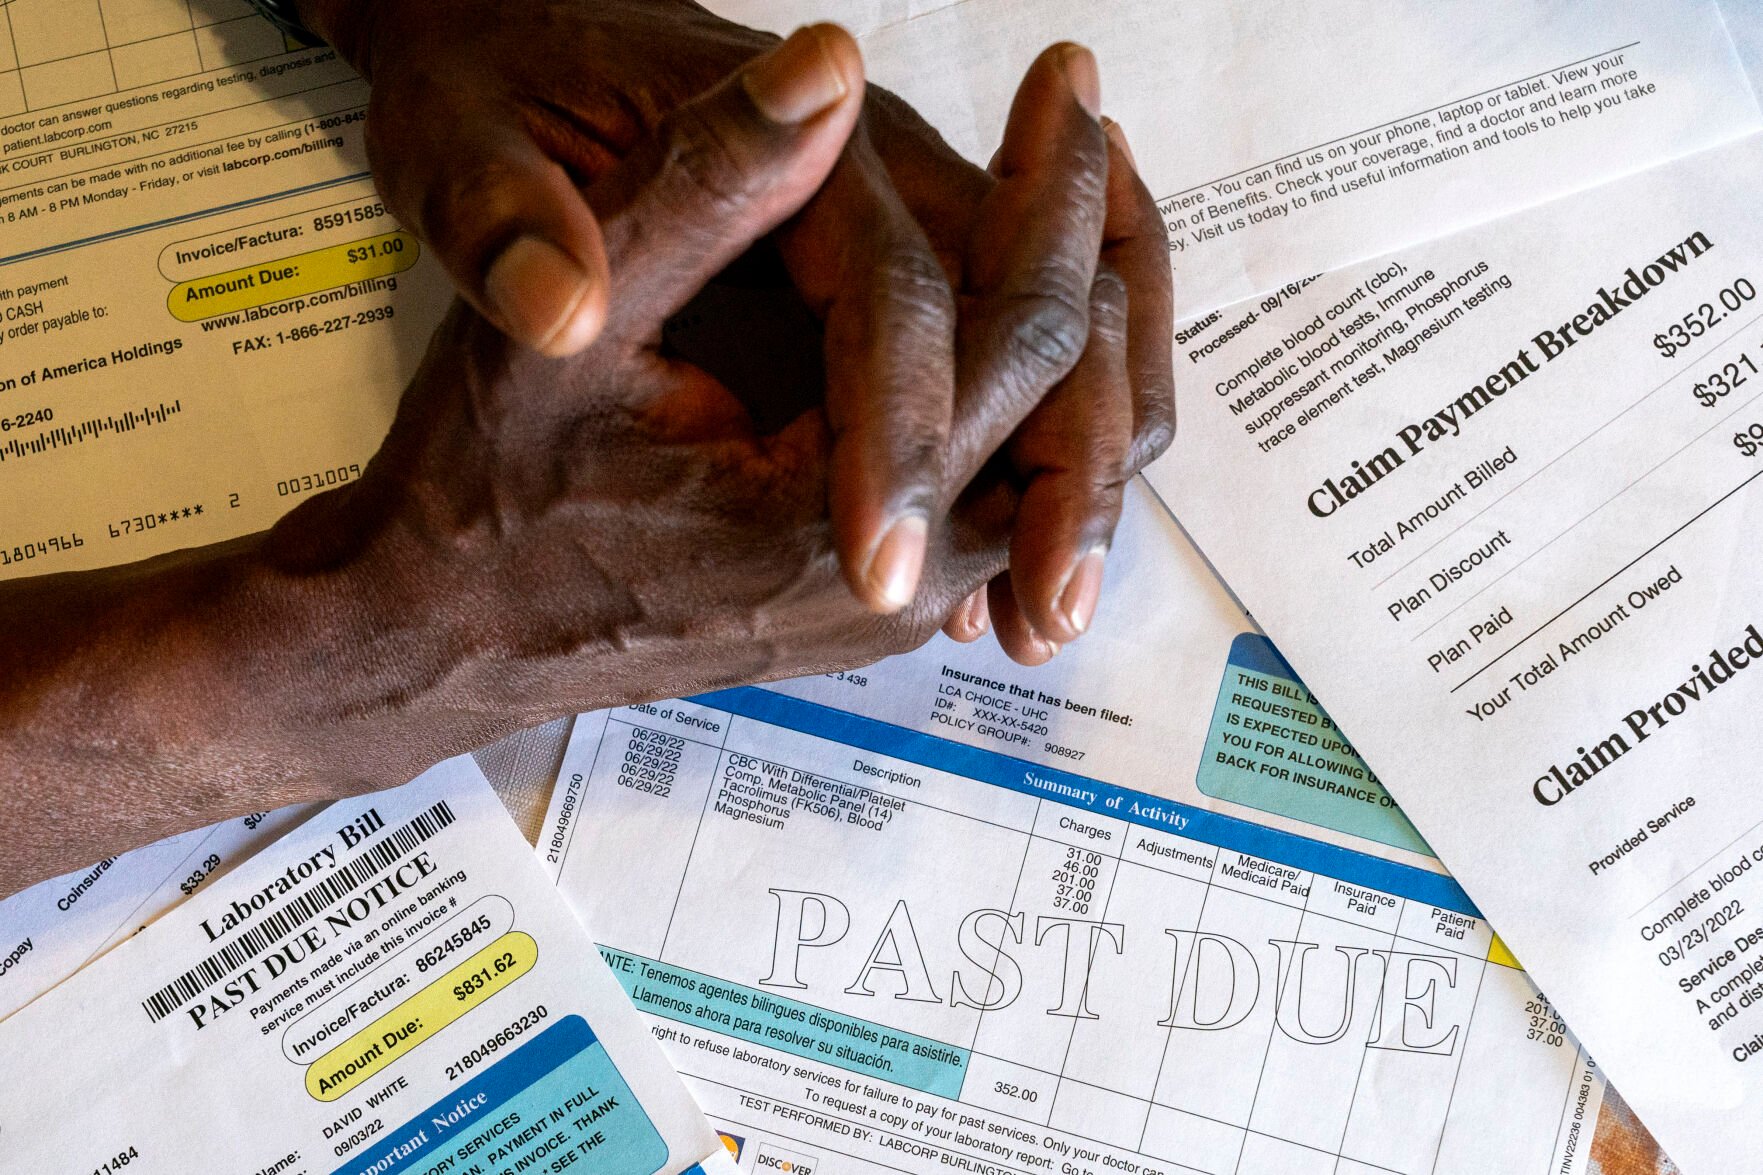
Jacquelyn Martin, Associated Press
David White, who after kidney surgery got hit with a lot of extra charges, sits with some of his medical bills June 26 at his home in Temple Hills, Md.
Debt experts say patients should attack medical bills with a plan. Here are key steps to take.
Check the numbers
Don’t stash the bill in a pile of mail and hope it goes away, but don’t rush to pay it without first understanding the amount.
“Especially if it’s a really high bill, consider it like an opening offer,” says Caitlin Donovan, a spokesperson for the nonprofit Patient Advocate Foundation, which helps critically or chronically ill patients deal with debt and insurance problems.
Medical bills can be rife with errors. They also may have been sent before insurance coverage was sorted out.
Donovan recommends comparing the bill with your insurer’s explanation of benefits. That’s a document the insurer sends that explains how your coverage will apply to the care you received. It can give you a sense for what you may still owe based on your deductible or the plan’s out-of-pocket maximum.
If something looks weird, call both the insurer and hospital for an explanation.
Someone at the hospital might have mistakenly entered the wrong code for the care you received or duplicated it. Request an itemized bill from the hospital to see if that happened.
But be aware that those bills also can be hard to interpret or contain errors that have little to do with the charge, Donovan said.
Know the law
The No Surprises Act debuted last year and offers a layer of protection. Patients should check to make sure their care provider is following that law.
It prevents doctors or hospitals in many situations from billing insured patients higher rates when the care providers are not in their insurer’s coverage network.
The law offers protection for most emergency care by basically requiring that patients receive in-network coverage with no additional billing from the provider. It also protects patients from huge bills for lab work or an out-of-network anesthesiologist when the patient was treated at an in-network hospital.
The Centers for Medicare and Medicaid Services has established a “No Surprises Help Desk” for people who have questions about whether their bill complies with the law. They can call (800) 985-3059 or submit a complaint online.

Jacquelyn Martin, Associated Press
David White stands next to a poster honoring him as a patient advocate.
Seek outside help
There are a host of for-profit and nonprofit organizations that can help people navigate medical bills.
The Patient Advocate Foundation helped David White recoup more than $2,000 he paid for routine lab work after his kidney transplant.
A case manager told White that a government database was causing complications with the claim. She also helped him file paperwork to correct the mistake.
“Every single penny that I paid out was refunded,” said the 61-year-old White, a volunteer foundation board member. “There’s just no way I could figure this out on my own.”
The foundation offers an online directory of potential resources for medical or prescription bill help.
Outside help might also include a state attorney general’s office, which may have a health advocacy unit or a consumer protection division.
Financial assistance
Once you have checked for errors, ask for financial assistance. Some hospital systems may provide help for people with income levels as high as six figures.
“People a lot of times assume they won’t qualify,” Donovan said.
Patients should be persistent in asking for help or finding out why an application was denied.
Many hospitals don’t do a great job letting patients know about available help, said Marceline White, executive director of Economic Action Maryland, a non-profit that helps people in that state apply for financial assistance.
“The onus is on the patient to apply for the assistance and do the work,” she said.
Ask for a discount if no financial assistance is available.
Bargain and budget
You’ve checked for errors and asked about discounts and financial assistance. Now you may have to confront a final invoice.
Ask about a payment plan. Many hospitals will offer options with no interest or a very low rate. But before committing to that, go over your budget to get a sense for what sort of payment you can handle.
Donovan noted that people who agree to a monthly bill that turns out to be too high may wind up having that debt land in collections if they can’t make payments.
“Then you’re in a whole new problem,” she said.
-
Study finds health care workers struggle to remember emergency codes
Canva
Access to health care services and the affordability of health insurance are crucial to overall health but vary widely across the United States. MoneyGeek analyzed a host of statistics, from health outcomes — such as preventable deaths and rates of certain diseases or risk factors — to health access and cost — such as how many people are uninsured and have affordable health insurance options available — to find the best and worst states for health care in the U.S.
SUMMARY FINDINGS:
- Hawaii is the top state for health care in the U.S. It has the best health outcomes in the country, with low preventable death (47 per 100,000 people), diabetes mortality and obesity rates. However, the state ranks fairly low for accessibility (No. 31).
- West Virginia has the worst health care in the nation. Though West Virginia ranks No. 6 for accessibility, it has the worst health outcomes of any state, with the highest rate of preventable deaths (126 preventable deaths among 100,000 residents) and diabetes mortalities. It also has the highest average private health insurance premiums ($8,546 per year) in the U.S.
- Vermont is the most expensive state for health care. The state has the third-highest annual private health care premiums in the country (averaging $7,886) and government spending on per capita health care costs at nearly $6,000. Vermont spends more than 13% of its total gross domestic product (GDP) on health care, while the national average is around 9%.
- Maryland has the lowest annual private health insurance premiums of any state ($4,052, on average). The national average annual cost across all states in the U.S. is $5,752.
-
Study finds health care workers struggle to remember emergency codes
MoneyGeek
The states with the best health care in the United States are those where people are generally healthier, have access to health care services and are less likely to be uninsured. The best states for health care are found all across the country, from Hawaii to Rhode Island. That said, 4 of the top 10 states on our list are located in the Northeast.
-
-
Study finds health care workers struggle to remember emergency codes
MoneyGeek
States that fare worse on our health care rankings tend to have higher costs for less access and higher rates of medical conditions like diabetes and obesity. The worst states for health care are concentrated regionally, with 8 of the 10 clustered in the South and Southeast.
MoneyGeek
States that fare worse on our health care rankings tend to have higher costs for less access and higher rates of medical conditions like diabetes and obesity. The worst states for health care are concentrated regionally, with 8 of the 10 clustered in the South and Southeast.
-
Study finds health care workers struggle to remember emergency codes
Canva
To evaluate health care in the United States, MoneyGeek looked at three categories of data that together create a comprehensive view of the overall quality of health care in each location. Those categories include:
- Health outcomes, including indicators such as rates of disease and risk factors like obesity and smoking, preventable deaths and infant mortality. These measures help answer the question: How healthy are the people who live here?
- Cost, including factors like how much the state spends on health care and the average cost of private health insurance. These measures help answer the question: How expensive is health care in this state?
- Access, including data on the number of primary care providers and hospital beds available, how many people are uninsured and how many people needed care but had difficulty getting it. These indicators help answer the question: How easy is it to get the health care you need in this state?
Within these three categories, we broke down the best and the worst states across a wide range of health care outcome, cost and access data points. Below is a brief summary of those findings, along with the top best and worst states for each data point.
Deep Blue States Across the US Have the Healthiest Residents
- Best States for Health Outcomes:
1. Hawaii
2. Vermont
3. California
4. Massachusetts
5. New York
- Worst States for Health Outcomes:
1. West Virginia
2. Mississippi
3. Louisiana
4. Tennessee
5. Kentucky
Southern States Have Highest Diabetes Mortality Rates
- States With Fewest Diabetes Mortalities per 100,000 Residents:
1. Hawaii: 17.0
2. Massachusetts: 17.2
3. Connecticut: 17.5
4. Vermont: 17.5
5. Colorado: 18.0
- States With Most Diabetes Mortalities per 100,000 Residents:
50. West Virginia: 41.3
49. Mississippi: 41.0
48. Arkansas: 33.8
47. Louisiana: 33.1
46. Oklahoma: 32.8
West Virginia's Preventable Death Rate Is Nearly Three Times Texas's
- States With the Lowest Rates of Preventable Deaths per 100,000 Residents:
1. Texas: 44.0
2. Utah: 45.0
3. New York: 45.3
4. Hawaii: 46.5
5. Nebraska: 46.6
- States With the Highest Rates of Preventable Deaths per 100,000 Residents:
50. West Virginia: 125.6
49. Tennessee: 88.7
48. Kentucky: 88.2
47. New Mexico: 88.0
46. Maine: 85.1
Northeast States Have Two Times the Primary Care Providers of Western States
- States With the Most Primary Care Providers per 100,000 Residents:
1. Rhode Island: 255.1
2. Massachusetts: 227.7
3. New York: 207.4
4. Connecticut: 197.8
5. Pennsylvania: 197.0
- States With the Fewest Primary Care Providers per 100,000 Residents:
50. Utah: 98.7
49. Idaho: 99.2
48. Nevada: 101.6
47. Texas: 109.0
46. Montana: 110.3
-
-
Study finds health care workers struggle to remember emergency codes
Canva
Overall Affordability Is Best in the Southwest, Worst in the Northeast
- States With Most Affordable Health Care:
1. New Mexico
2. Colorado
3. Maryland
4. Utah
5. South Carolina
- States With Least Affordable Health Care:
50. Vermont
49. West Virginia
48. New York
47. Massachusetts
46. New Jersey
Health Insurance Is Nearly Two Times as Expensive in Worst States for Costs
- States With Lowest Average Cost of Private Health Insurance:
1. Maryland: $4,052
2. New Mexico: $4,063
3. Minnesota: $4,109
4. Michigan: $4,335
5. Colorado: $4,368
- States With Highest Average Cost of Private Health Insurance:
50. West Virginia: $8,546
49. New York: $8,501
48. Vermont: $7,886
47. Wyoming: $7,646
46. New Jersey: $7,000
Northeast States Have Lowest Uninsured Rates; Southern States, Highest
- States With Lowest Uninsured Population Rate:
1. Massachusetts: 3.0%
2. Rhode Island: 4.1%
3. Hawaii: 4.2%
4. Vermont: 4.5%
5. Minnesota: 4.9%
- States With Highest Uninsured Population Rate:
50. Texas: 18.4%
49. Oklahoma: 14.3%
48. Georgia: 13.4%
47. Florida: 13.2%
46. Mississippi: 13.0%
-
Study finds health care workers struggle to remember emergency codes
Tada Images // Shutterstock
To explore and rank health care quality by state, MoneyGeek analyzed three core categories — health outcomes, cost and access to care — using health care data from the Kaiser Family Foundation, the Centers for Disease Control and HealthData.gov. We assigned weights to each factor within these core categories to measure health care quality.
Outcome Factor Rank: Based on cumulative scores across the following factors:
- Infant mortality rate: The number of infant deaths per 1,000 live births
- Preventable death rate: Deaths that can be avoided through effective preventative health care and interventions per 100,000 residents
- Diabetes mortality rate: Deaths attributed to diabetes per 100,000 residents
- Obesity: Percentage of population considered obese
- Smoking rate: Percentage of adults who reported smoking
- Life expectancy: The average number of years a person can expect to live
- Suicide rates: Suicide deaths among persons age 12 and over per 100,000 residents
- New HIV cases per 100,000 residents over the age of 13
- Opioid-related hospital stay rate: Inpatient hospital stays involving opioid-related diagnoses per 100,000 residents
- Cost Factor Rank: Based on cumulative scores across the following factors:
- Health care spending as a percentage of state GDP: Government spending on health care and social assistance out of total state GDP
- State government spending on health care and social assistance per resident
- Average annual private health insurance premium costs
- Access Factor Rank: Based on cumulative score across the following factors:
- Number of hospital beds per 1,000 residents
- Number of primary care providers per 100,000 residents
- Primary care provider shortage areas (HPSAs) by state: Designations that identify areas of the U.S. experiencing health care professional shortages
- Percentage of population with access to any insurance versus just health insurance
- Ease of access to care at the doctor's office or clinic using Medicare
- Ease of access to care at a specialist using Medicare
MoneyGeek used the following weightings in our analysis:
- Preventable death rate: Full weight
- Infant mortality rate: Full weight
- Life expectancy: Half weight
- Diabetes mortalities per 100,000 people: Half weight
- Obesity as a percentage of the population: Half weight
- Hospital inpatient stays involving opioid-related diagnoses per 100,00 people: Quarter weight
- Smoking rate among adults: Quarter weight
- Suicide deaths among persons ages 12 and older per 100,000 people: Quarter weight
- New HIV cases among persons ages 13 and older per 100,000 people: Quarter weight
- Annual health insurance costs: Full weight
- Health care spending as a percentage of state GDP: Half weight
- Health care spending as a share of GDP per resident: Half weight
- Percentage of population with health insurance: Full weight
- Number of hospital beds per 100,000 people: Half weight
- Adults who had a doctor's office or clinic visit in the last 12 months and needed care, tests, or treatment who sometimes or never found it easy to get the care, tests, or treatment, Medicare fee-for-service: Quarter weight
- Adults who needed to see a specialist in the last 6 or 12 months who sometimes or never found it easy to see a specialist, Medicare fee-for-service: Quarter weight
- Primary care health professional shortage areas: % of need met to remove shortage designation: Quarter weight
- Number of primary care providers per 100,000 population: Quarter weight
SOURCES
This story originally appeared on MoneyGeek and has been independently reviewed to meet journalistic standards.
