The census conducted in the U.S. every 10 years is meant to count everyone. But it doesn’t actually count everyone.
After every census, the U.S. Census Bureau reports how well it did at counting every person in the country. In 2020, as in past years, the census didn’t get a completely accurate count, according to the bureau’s own reporting. The official census number reported more non-Hispanic whites and people of Asian backgrounds in the U.S. than there actually were. And it reported too few Blacks, Hispanics and Native Americans who live on reservations.
The Conversation U.S. asked Aggie Yellow Horse, a sociologist and demographer at Arizona State University, to explain why, and how, the census misses people, and how it’s possible to assess who wasn’t counted.
1. Who gets missed in the census?
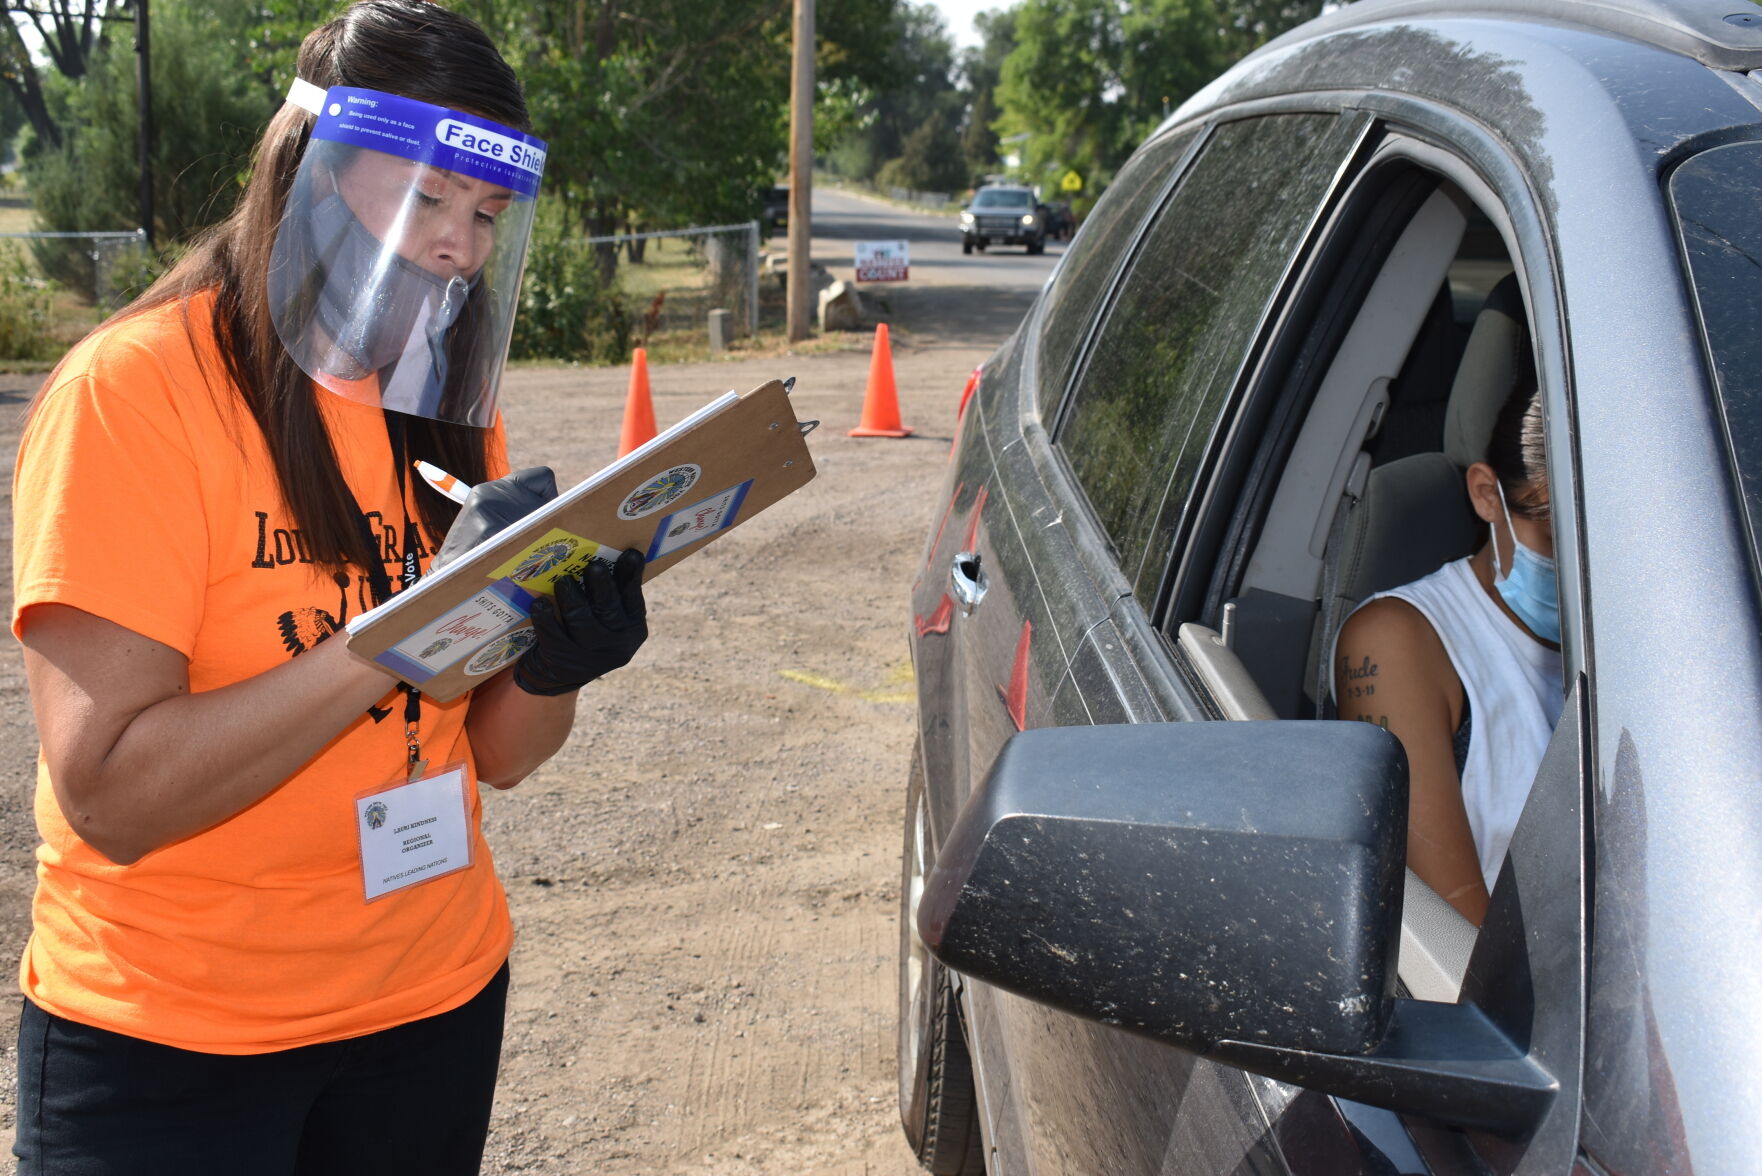
The people most commonly missed are those with low income, people who rent or don’t have homes at all, people who live in rural areas and people who don’t speak or read English well. Often, these are people of color — Black Americans; Indigenous peoples; or people of Hispanic, Asian or Pacific Islander backgrounds.
Because of their living situations, these people can be hard for census takers to track down in the first place. And they may be more reluctant to participate because of concerns about confidentiality, fear of repercussions and distrust of government.
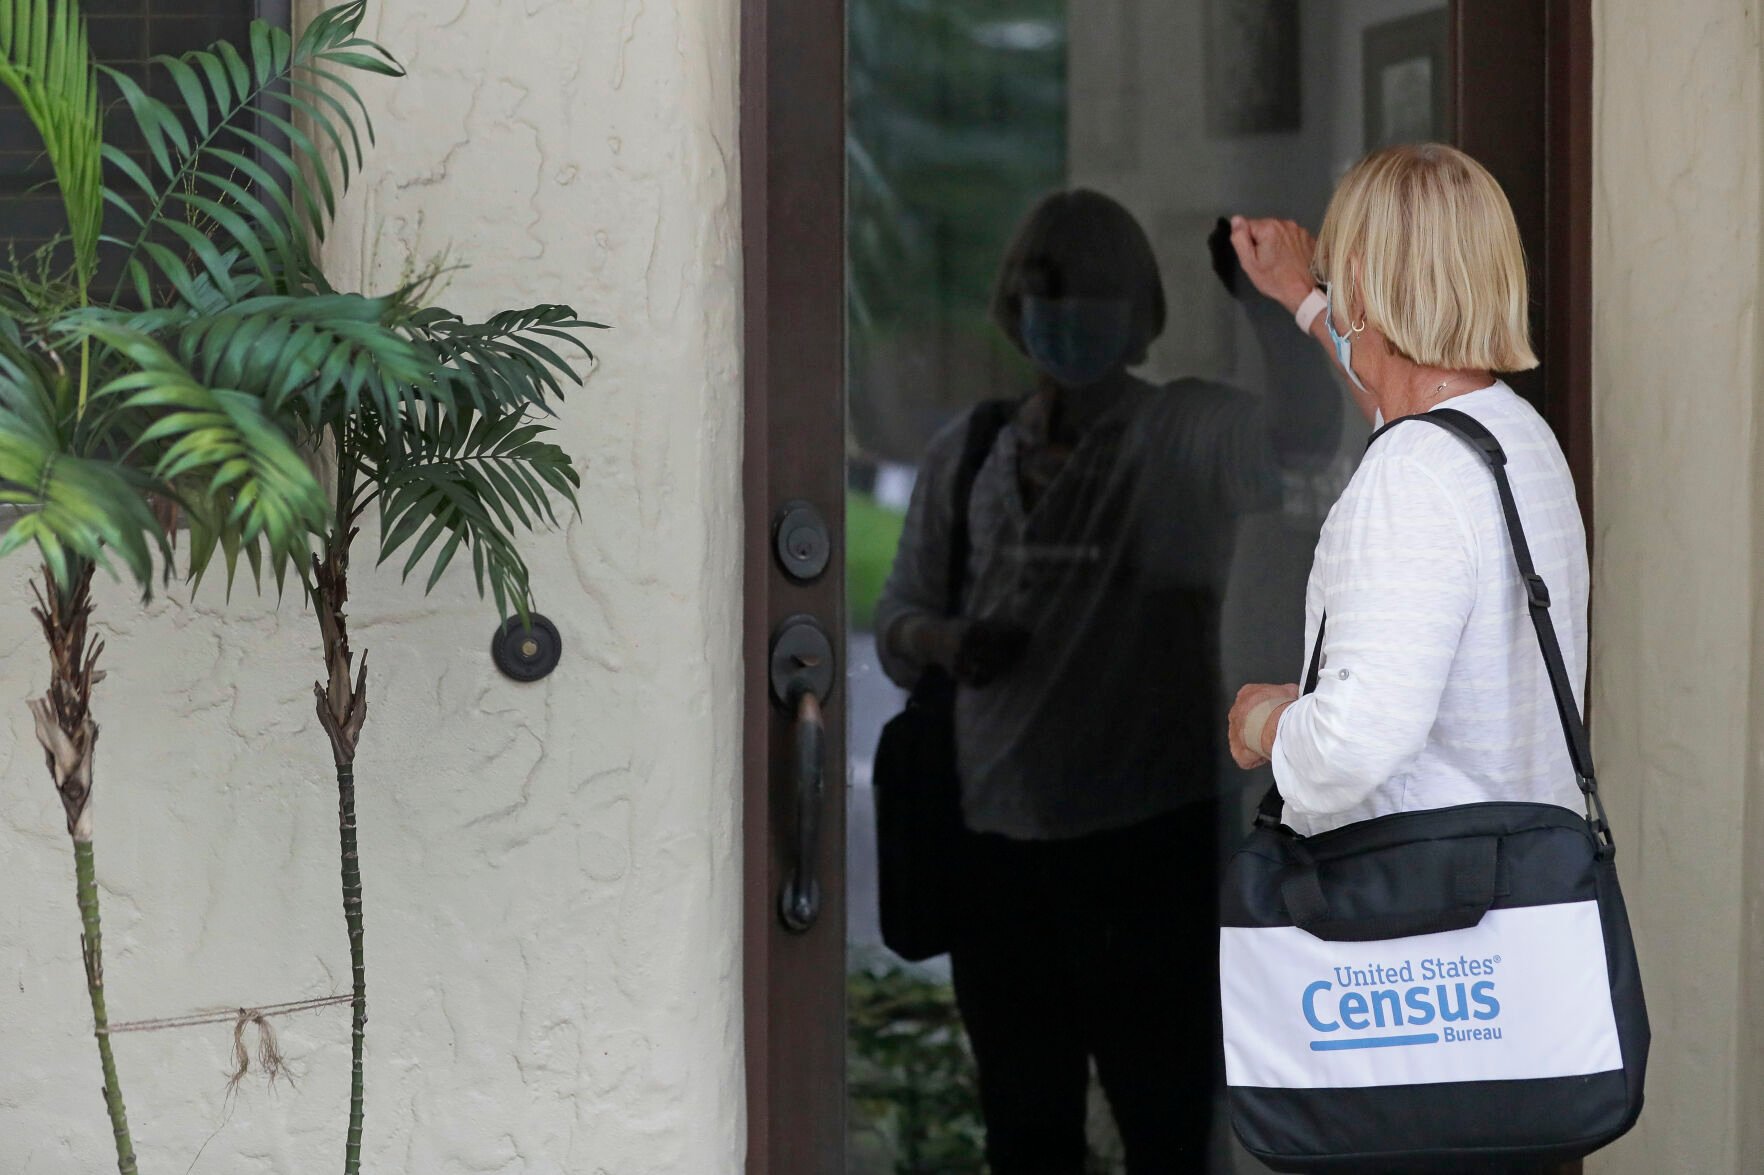
Nevertheless, the U.S. Census Bureau tries to count everyone, aiming targeted public relations campaigns at specific communities to encourage members to participate. In addition, Census Bureau employees knock on doors in person across the country, trying to follow up with those who did not respond to mailings, announcements and events.
However, the pandemic made that process more difficult for the 2020 census, both by making people uncomfortable with in-person visits and by shortening the timeline for collecting the data.
2. Who got missed?
The official estimates show that the 2020 census was really very accurate, capturing 99.8% of the nation’s residents overall. But the census missed counting 3.3% of Black Americans, 5.6% of American Indians or Alaskan Natives who live on reservations and 5% of people of Hispanic or Latino origin. This could mean missing about 1.4 million Black Americans; 49,000 American Indians or Alaskan Natives who live on reservations; and 3.3 million people of Hispanic or Latino origin.
This performance is much worse than in the previous two censuses, when smaller proportions of those populations were missed.
The 2020 census also counted 1.64% more non-Hispanic whites than there actually are in the country. For example, college students could have been counted twice — at their college residence and at their parents’ home.
3. How can they count the people who were missed?
It can be puzzling to understand how the Census Bureau can know how many people it missed. Efforts for measuring census accuracy started in 1940. Census officials use two methods.
First, the Census Bureau uses demographic analysis to create an estimate of the population. That means the bureau calculates how many people might be added to the population counts, through birth registrations and immigration records, and how many people might be removed from them, through death record or emigration reports. Comparing that estimate with the actual count can reveal an overall scale of how many people the census missed.
As a second measure, the Census Bureau runs what it calls a “post-enumeration survey,” taken after the initial census data is collected. The survey is conducted independent of the census and randomly sent to a small group of households from census blocks in each state, the District of Columbia and Puerto Rico. The results of that survey are compared with the census results for those households and can reveal how many people were missed, or if some people were counted twice or counted in the wrong place.
4. Can the Census Bureau fix its data?
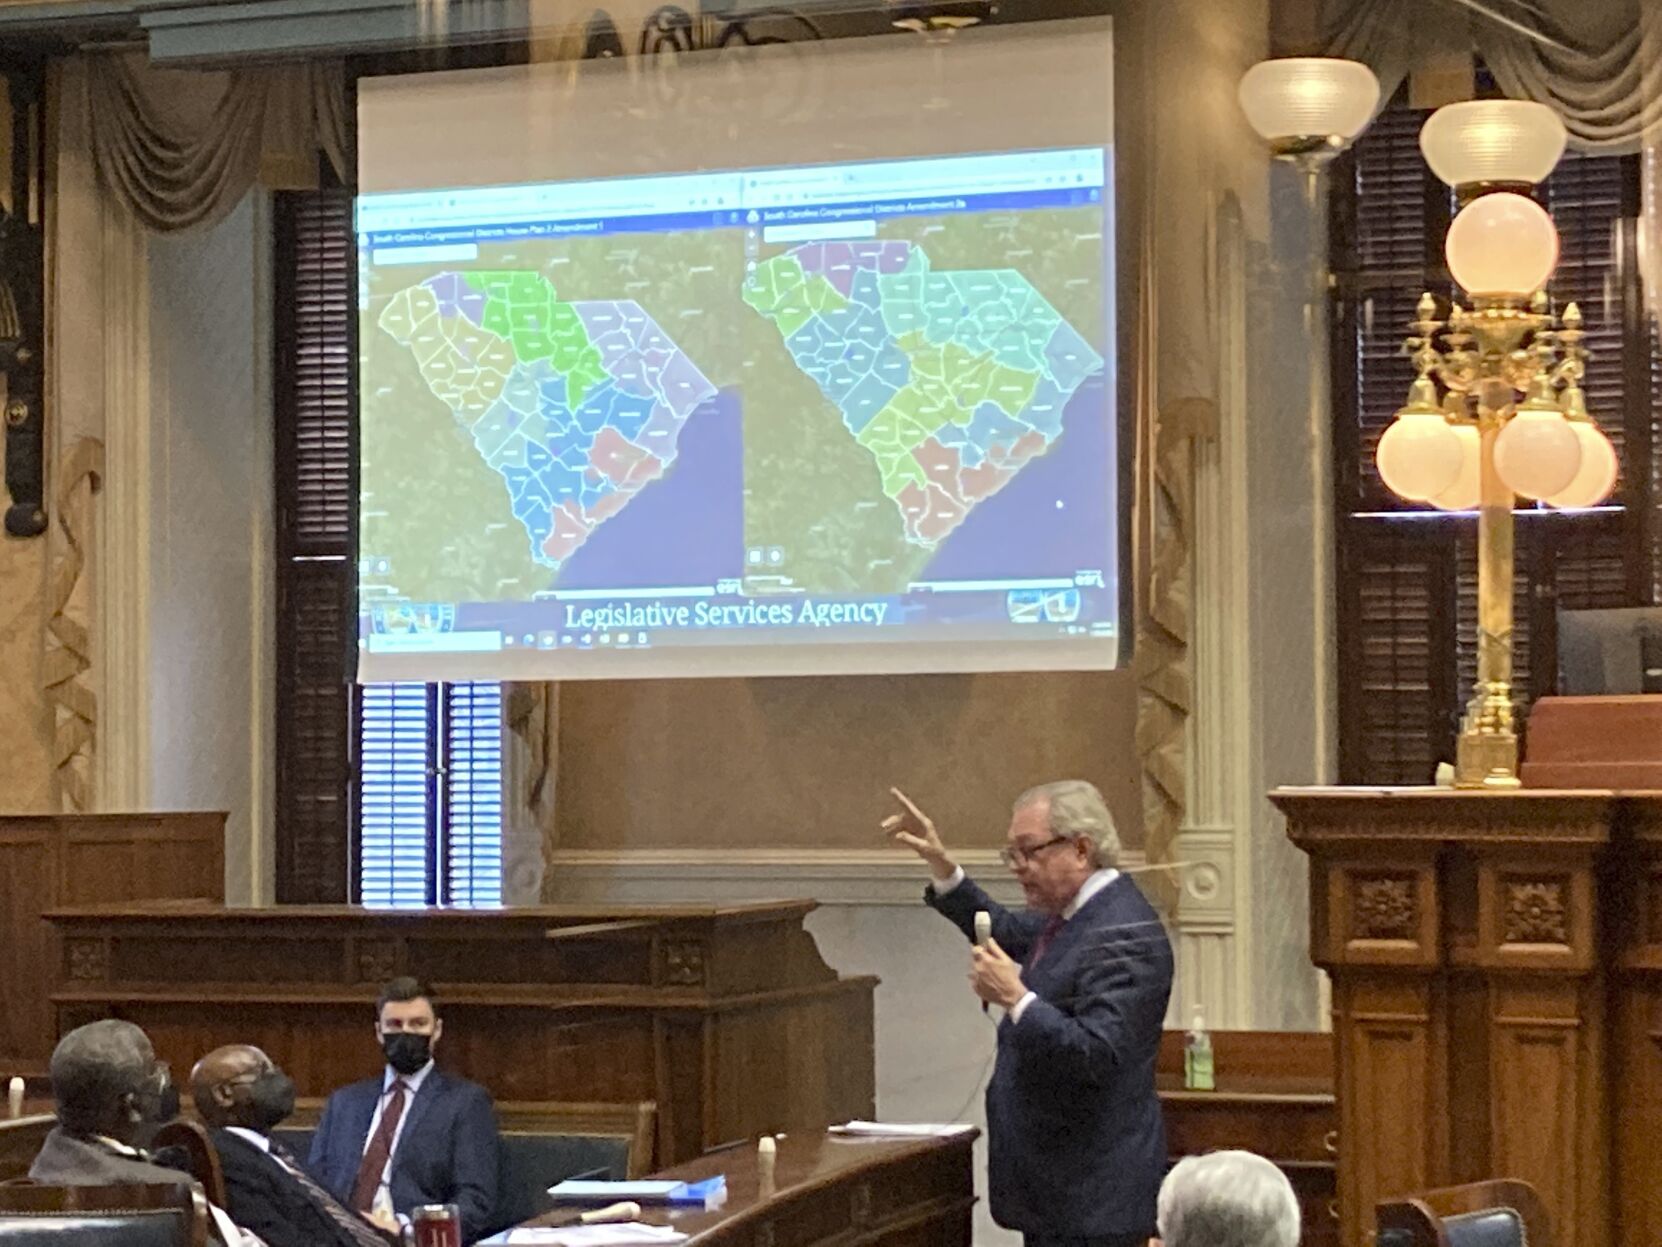
The Census Bureau has determined that its 2020 data is not accurate and has measured the amount of that inaccuracy. But in 1999, the Supreme Court ruled that the bureau cannot adjust the numbers it sent to Congress and the states for the purpose of allocating seats in the U.S. House of Representatives and, therefore, Electoral College votes. That’s because federal law bars the use of statistical sampling in apportionment decisions and requires those changes to be made only on the basis of how many people were actually counted. That means political representation in Congress may not accurately reflect the constituencies the representatives serve.
But the numbers can be adjusted when used to divide up federal funding for essential services in communities around the nation. More than US$675 billion a year is provided to tribal, state and local governments proportionally according to their population numbers.
However, that adjustment happens only if tribal, state or local officials ask for it. The Census Bureau’s Count Question Resolution program can correct 2020 census data until June 2023. After the 2010 census, the program received requests from 1,180 governments, of out about 39,000 nationwide. As a result, about 2,700 people were newly added to the census count, and about 48,000 household addresses were corrected.
This approach can lessen the harm done to communities where the census count missed people. But it doesn’t prevent the Census Bureau from missing them — or others — in the next census.
[Get the best of The Conversation, every weekend. Sign up for our weekly newsletter.]
Aggie Yellow Horse does not work for, consult, own shares in or receive funding from any company or organization that would benefit from this article, and has disclosed no relevant affiliations beyond their academic appointment.
This article is republished from The Conversation under a Creative Commons license.
-
America’s biggest metros lost residents in 1st full year of pandemic
AP file
NEW YORK CITY: The exodus from the biggest U.S. metropolitan areas was led by New York, which lost almost 328,000 residents. The decline was driven by people leaving for elsewhere in the U.S., even though the metro area gained new residents from abroad and births outpaced deaths. Its population dipped to 19.7 million residents.
-
America’s biggest metros lost residents in 1st full year of pandemic
AP file
LOS ANGELES: Los Angeles lost almost 176,000 residents, the second biggest drop among U.S. metro areas. Like New York, births outnumbered deaths, and there was an increase in international residents. But it wasn't even close enough to overcome the loss of tens of thousands of residents who moved away. Its population dropped to 12.9 million residents.
-
-
America’s biggest metros lost residents in 1st full year of pandemic
AP file
CHICAGO: The loss of more than 91,000 residents in greater Chicago was driven by people moving away. As in New York and Los Angeles, births outpaced deaths in Chicago, but the increase was much smaller than the other two metro areas. Its population stood at 9.5 million residents.
AP file
CHICAGO: The loss of more than 91,000 residents in greater Chicago was driven by people moving away. As in New York and Los Angeles, births outpaced deaths in Chicago, but the increase was much smaller than the other two metro areas. Its population stood at 9.5 million residents.
-
America’s biggest metros lost residents in 1st full year of pandemic
AP file
DALLAS: The Dallas area grew by more than 97,000 residents, the most of any U.S. metro area in 2021. Close to two-thirds of the growth came from people moving from elsewhere, and the rest came from births. Its population jumped to 7.7 million residents.
AP file
DALLAS: The Dallas area grew by more than 97,000 residents, the most of any U.S. metro area in 2021. Close to two-thirds of the growth came from people moving from elsewhere, and the rest came from births. Its population jumped to 7.7 million residents.
-
-
America’s biggest metros lost residents in 1st full year of pandemic
AP file
HOUSTON: The 69,000 residents that Houston gained was the third-highest of any U.S. metro area. Births accounted for more than half of the growth, though the migration of new residents wasn't far behind. More than a third of the migration to the Houston area came from outside the U.S. Houston's population stood at 7.2 million.
-
America’s biggest metros lost residents in 1st full year of pandemic
AP file
WASHINGTON: The nation's capital lost almost 29,000 residents in its metro area. A net gain of 25,000 births over deaths wasn't enough to overcome the tens of thousands of residents who left the region. Its population was 6.3 million residents.
AP file
WASHINGTON: The nation's capital lost almost 29,000 residents in its metro area. A net gain of 25,000 births over deaths wasn't enough to overcome the tens of thousands of residents who left the region. Its population was 6.3 million residents.
-
-
America’s biggest metros lost residents in 1st full year of pandemic
AP file
PHILADELPHIA: Greater Philadelphia lost more than 13,000 residents. Around three-quarters of the loss came from people leaving, and the rest was caused by deaths outnumbering births. The metro area had 6.2 million residents.
AP file
PHILADELPHIA: Greater Philadelphia lost more than 13,000 residents. Around three-quarters of the loss came from people leaving, and the rest was caused by deaths outnumbering births. The metro area had 6.2 million residents.
-
America’s biggest metros lost residents in 1st full year of pandemic
AP file
ATLANTA: The Atlanta area grew by almost 43,000 residents. Almost 60% of the new residents were people who had moved from elsewhere, while the rest came from births. It had 6.1 million residents.
AP file
ATLANTA: The Atlanta area grew by almost 43,000 residents. Almost 60% of the new residents were people who had moved from elsewhere, while the rest came from births. It had 6.1 million residents.
-
-
America’s biggest metros lost residents in 1st full year of pandemic
AP file
MIAMI: Greater Miami declined by more than 34,000 residents. Residents moving away from the metro area were more than double the substantial growth in new residents arriving from abroad. Deaths accounted for about 5% of the population loss. The metro had 6 million residents.
AP file
MIAMI: Greater Miami declined by more than 34,000 residents. Residents moving away from the metro area were more than double the substantial growth in new residents arriving from abroad. Deaths accounted for about 5% of the population loss. The metro had 6 million residents.
-
America’s biggest metros lost residents in 1st full year of pandemic
AP file
PHOENIX: Greater Phoenix had the second-largest population gain among U.S. metros, jumping by more than 78,000 residents. Almost all of the growth was driven by residents from other places moving to the Valley of the Sun. More so than Dallas or Houston, the natural increase from births accounted for a very small share of the growth — around 10%. Its population grew to 4.9 million residents.
