MEXICO CITY — Each month, Antón Martínez, 38, sets aside $200 from his wages as a dishwasher in the United States to send home to his mother in Nicaragua.
Inti Ocon, Associated Press
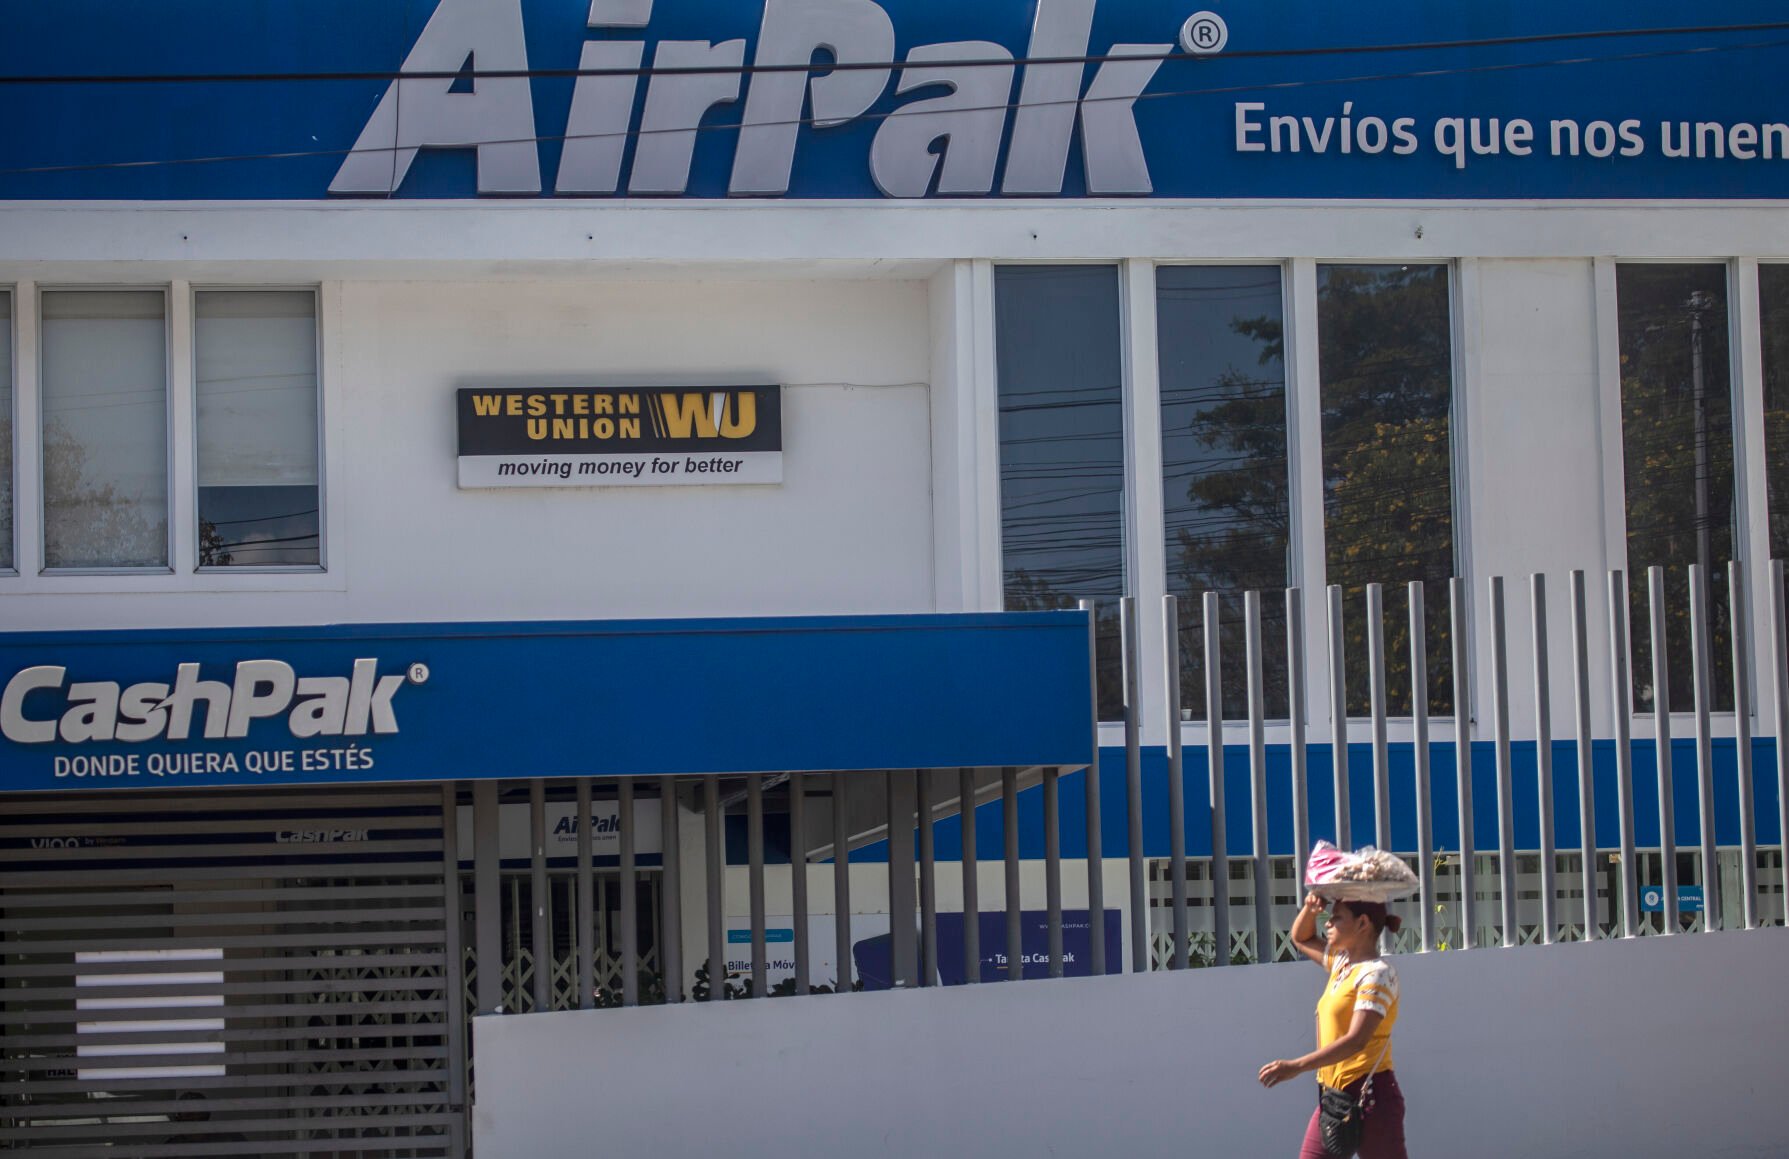
A candy vendor walks past a Western Union branch Feb. 25 in Managua, Nicaragua.
Martínez wishes it could be more, but he’s still trying to find his footing in the new country and pay off the debt of his migration. His monthly contribution to family back home was part of a 50% surge in remittances to Nicaragua in 2022, a massive jump that analysts attribute to the thousands of Nicaraguans who emigrated to the U.S. in the past two years.
They have been leaving as the government intensifies a crackdown on opposition voices since early 2021, high global inflation slams families’ buying power and job opportunities remain limited at home.
That swell of Nicaraguan arrivals to the U.S. was part of the reason the Biden administration announced in January that it would begin turning them away at the border if they did not first register online to make asylum petitions. Their numbers have dropped precipitously since.
But Martínez, who arrived in late 2021, and others already there are keeping Nicaragua’s economy afloat with the more than $3.2 billion they sent home last year.
Last year’s huge jump, “can only be explained by the disproportionate increase in migrants,” Nicaraguan economist Enrique Sáenz said.
Emigration “has become (President Daniel Ortega’s) main macroeconomic policy and his main social policy,” Saenz said.
Ortega’s increasingly authoritarian government has drawn sanctions from the U.S. government and Europe, but the measures have been targeted toward his inner circle and members of his administration to avoid adding more economic hardship for average Nicaraguans.
Still, for the fiscal year ending last September, U.S. authorities recorded more than 163,000 encounters with Nicaraguans, more than three times the 2021 total. Encounters peaked in December with more than 35,000 and then plummeted to 3,377 in January.
The reasons vary from a lack of economic opportunity to outright persecution of political opponents and voices of dissent. Ortega cracked down violently after popular protests broke out in April 2018. He ratcheted up the pressure in 2021 ahead of national elections.
Earlier this month, he put 222 imprisoned opponents on a plane to Washington, saying he was sending the “terrorists” back to their foreign sponsor.
Until last year, Costa Rica had been the primary destination for Nicaraguans in recent years. But the small neighboring country’s asylum system is overwhelmed, the wait now stretches years and its economy has struggled to recover from the COVID-19 pandemic. Costa Rica President Rodrigo Chaves tightened the generous asylum system in December, arguing that it was being abused by economic migrants.
Those factors made the U.S. a more attractive destination despite the distance. Ortega blames the U.S. sanctions for the emigration.
In Martínez’s case, he left because he participated in anti-government protests in 2018 and feared he could be arrested. “I miss my mother and I love Nicaragua, but there was nothing else to do. It was leave or be taken prisoner at some point.”
Many others reached the same decision.
Nicaragua’s government released data late last year showing that between Sept. 17 and Oct. 7, it issued 20,192 passports. In the capital, residents camped out on sidewalks just to get one of the limited numbers called each day to process a passport application.
Sabrina Gazol Moncada, a 28-year-old college student who had to drop out to find work, left Nicaragua in October, the month after her husband travelled to the U.S.
“It’s a really difficult decision to make, because ultimately you are leaving your country, your family, the people who support you and love you,” she said.
Gazol moved north on buses, on foot and stuffed into semi-trailers with 200 others. After three weeks of often rough and frightening travel through Central America and Mexico, Gazol crossed the Rio Grande near Eagle Pass, Texas, turned herself over to Border Patrol and began the process to seek asylum.
In Nicaragua, “people who are not with the Ortega regime are threatened and persecuted, there’s no freedom of expression,” she said.
She had not been able to send money home since arriving in the U.S., because she was still awaiting permission to work as she pursued asylum.
“In Nicaragua, the government does what it wants and everybody is looking for a way out,” she said. “In the end, Nicaragua is going to be left without young people, it’s going to be a ghost country.”
-
A survivor of the migrant trailer: ‘They couldn’t breathe’
Shutterstock
Photo Credit: spyarm / Shutterstock
With a foreign-born population of more than 44 million, the U.S. has the largest number of immigrants in the world. In fact, research from the Pew Research Center shows that the U.S. immigrant population accounts for one-fifth of the world’s migrants. While U.S. immigrants come from almost every country in the world, Mexico is the most common country of origin for the foreign-born population.
From the period of 1850 to 2020, when the most recent data is available, the foreign-born population share hit a high of 14.8% in 1900. From 1920 to 1980, the share of immigrants fell, dropping to a low of 4.7% in 1980. Until recently, the immigrant share of the population had been climbing and was at a near historic high in 2019 before the pandemic. The share of immigrants dropped slightly in 2020 to 13.5%, down from the 13.7% it had stood at for the last several years.
-
A survivor of the migrant trailer: ‘They couldn’t breathe’
Accounting for 24.8% of the foreign-born population, Mexico claims the largest number of U.S. immigrants. The Chinese and Indian immigrant populations are also large, making up a collective 12.2% of the foreign-born population. Pew Research Center analysis of Census Bureau data shows that about one million immigrants arrive in the U.S. each year, and the most common region for new immigrants is now Asia, which recently surpassed Hispanic countries.
Accounting for 24.8% of the foreign-born population, Mexico claims the largest number of U.S. immigrants. The Chinese and Indian immigrant populations are also large, making up a collective 12.2% of the foreign-born population. Pew Research Center analysis of Census Bureau data shows that about one million immigrants arrive in the U.S. each year, and the most common region for new immigrants is now Asia, which recently surpassed Hispanic countries.
-
-
A survivor of the migrant trailer: ‘They couldn’t breathe’
While immigrants live in every U.S. state, some parts of the country have larger foreign-born populations than others. Over one-fourth of California’s population is foreign-born—mostly coming from Mexico—making California the top state for immigrants. New Jersey and New York also have large immigrant populations, with 22.7% and 22.4% of their populations being immigrants, respectively. Alternatively, Montana and West Virginia have very small immigrant populations, accounting for just 2.2% and 1.6% of their populations, respectively.
While immigrants live in every U.S. state, some parts of the country have larger foreign-born populations than others. Over one-fourth of California’s population is foreign-born—mostly coming from Mexico—making California the top state for immigrants. New Jersey and New York also have large immigrant populations, with 22.7% and 22.4% of their populations being immigrants, respectively. Alternatively, Montana and West Virginia have very small immigrant populations, accounting for just 2.2% and 1.6% of their populations, respectively.
-
A survivor of the migrant trailer: ‘They couldn’t breathe’
To determine the U.S. metropolitan areas with the largest immigrant populations, researchers at BackgroundChecks.org analyzed the latest data from the U.S. Census Bureau. The researchers ranked metros according to the foreign-born population share. Researchers also calculated the most common country of origin, the total foreign-born population, and the total population.
To improve relevance, only metropolitan areas with at least 100,000 people were included in the analysis. Additionally, metro areas were grouped into the following cohorts based on population size:
- Small metros: 100,000–349,999
- Midsize metros: 350,000–999,999
- Large metros: more than 1,000,000
Here are the metros with the largest immigrant populations.
-
-
A survivor of the migrant trailer: ‘They couldn’t breathe’
-
A survivor of the migrant trailer: ‘They couldn’t breathe’
Shutterstock
Photo Credit: Andriy Blokhin / Shutterstock
- Foreign-born population share: 18.5%
- Most common country of origin: Mexico
- Total foreign-born population: 432,837
- Total population: 2,338,866
Shutterstock
Photo Credit: Andriy Blokhin / Shutterstock
- Foreign-born population share: 18.5%
- Most common country of origin: Mexico
- Total foreign-born population: 432,837
- Total population: 2,338,866
-
-
A survivor of the migrant trailer: ‘They couldn’t breathe’
Shutterstock
Photo Credit: f11photo / Shutterstock
- Foreign-born population share: 18.5%
- Most common country of origin: Mexico
- Total foreign-born population: 1,376,117
- Total population: 7,451,858
Shutterstock
Photo Credit: f11photo / Shutterstock
- Foreign-born population share: 18.5%
- Most common country of origin: Mexico
- Total foreign-born population: 1,376,117
- Total population: 7,451,858
-
A survivor of the migrant trailer: ‘They couldn’t breathe’
Shutterstock
Photo Credit: Songquan Deng / Shutterstock
- Foreign-born population share: 18.8%
- Most common country of origin: Colombia
- Total foreign-born population: 481,158
- Total population: 2,560,260
Shutterstock
Photo Credit: Songquan Deng / Shutterstock
- Foreign-born population share: 18.8%
- Most common country of origin: Colombia
- Total foreign-born population: 481,158
- Total population: 2,560,260
-
-
A survivor of the migrant trailer: ‘They couldn’t breathe’
Shutterstock
Photo Credit: Travellaggio / Shutterstock
- Foreign-born population share: 18.9%
- Most common country of origin: China
- Total foreign-born population: 918,197
- Total population: 4,854,808
Shutterstock
Photo Credit: Travellaggio / Shutterstock
- Foreign-born population share: 18.9%
- Most common country of origin: China
- Total foreign-born population: 918,197
- Total population: 4,854,808
-
A survivor of the migrant trailer: ‘They couldn’t breathe’
Shutterstock
Photo Credit: mahaloshine / Shutterstock
- Foreign-born population share: 19.2%
- Most common country of origin: Mexico
- Total foreign-born population: 754,455
- Total population: 3,928,498
Shutterstock
Photo Credit: mahaloshine / Shutterstock
- Foreign-born population share: 19.2%
- Most common country of origin: Mexico
- Total foreign-born population: 754,455
- Total population: 3,928,498
-
-
A survivor of the migrant trailer: ‘They couldn’t breathe’
Shutterstock
Photo Credit: Jon Bilous / Shutterstock
- Foreign-born population share: 21.1%
- Most common country of origin: Mexico
- Total foreign-born population: 970,476
- Total population: 4,600,396
Shutterstock
Photo Credit: Jon Bilous / Shutterstock
- Foreign-born population share: 21.1%
- Most common country of origin: Mexico
- Total foreign-born population: 970,476
- Total population: 4,600,396
-
A survivor of the migrant trailer: ‘They couldn’t breathe’
Shutterstock
Photo Credit: Virrage Images / Shutterstock
- Foreign-born population share: 22.1%
- Most common country of origin: Mexico
- Total foreign-born population: 492,617
- Total population: 2,228,866
Shutterstock
Photo Credit: Virrage Images / Shutterstock
- Foreign-born population share: 22.1%
- Most common country of origin: Mexico
- Total foreign-born population: 492,617
- Total population: 2,228,866
-
-
A survivor of the migrant trailer: ‘They couldn’t breathe’
Shutterstock
Photo Credit: ESB Professional / Shutterstock
- Foreign-born population share: 22.8%
- Most common country of origin: El Salvador
- Total foreign-born population: 1,425,904
- Total population: 6,250,309
Shutterstock
Photo Credit: ESB Professional / Shutterstock
- Foreign-born population share: 22.8%
- Most common country of origin: El Salvador
- Total foreign-born population: 1,425,904
- Total population: 6,250,309
-
A survivor of the migrant trailer: ‘They couldn’t breathe’
Shutterstock
Photo Credit: Sean Pavone / Shutterstock
- Foreign-born population share: 22.9%
- Most common country of origin: Mexico
- Total foreign-born population: 762,260
- Total population: 3,323,970
Shutterstock
Photo Credit: Sean Pavone / Shutterstock
- Foreign-born population share: 22.9%
- Most common country of origin: Mexico
- Total foreign-born population: 762,260
- Total population: 3,323,970
-
-
A survivor of the migrant trailer: ‘They couldn’t breathe’
Shutterstock
Photo Credit: Tomas Simkus / Shutterstock
- Foreign-born population share: 23.3%
- Most common country of origin: Mexico
- Total foreign-born population: 1,623,239
- Total population: 6,979,613
Shutterstock
Photo Credit: Tomas Simkus / Shutterstock
- Foreign-born population share: 23.3%
- Most common country of origin: Mexico
- Total foreign-born population: 1,623,239
- Total population: 6,979,613
-
A survivor of the migrant trailer: ‘They couldn’t breathe’
Shutterstock
Photo Credit: Lukas Uher / Shutterstock
- Foreign-born population share: 29.3%
- Most common country of origin: Dominican Republic
- Total foreign-born population: 5,652,129
- Total population: 19,261,570
Shutterstock
Photo Credit: Lukas Uher / Shutterstock
- Foreign-born population share: 29.3%
- Most common country of origin: Dominican Republic
- Total foreign-born population: 5,652,129
- Total population: 19,261,570
-
-
A survivor of the migrant trailer: ‘They couldn’t breathe’
Shutterstock
Photo Credit: yhelfman / Shutterstock
- Foreign-born population share: 30.7%
- Most common country of origin: China
- Total foreign-born population: 1,443,907
- Total population: 4,709,220
Shutterstock
Photo Credit: yhelfman / Shutterstock
- Foreign-born population share: 30.7%
- Most common country of origin: China
- Total foreign-born population: 1,443,907
- Total population: 4,709,220
-
A survivor of the migrant trailer: ‘They couldn’t breathe’
Shutterstock
Photo Credit: Sean Pavone / Shutterstock
- Foreign-born population share: 32.7%
- Most common country of origin: Mexico
- Total foreign-born population: 4,325,660
- Total population: 13,211,027
Shutterstock
Photo Credit: Sean Pavone / Shutterstock
- Foreign-born population share: 32.7%
- Most common country of origin: Mexico
- Total foreign-born population: 4,325,660
- Total population: 13,211,027
-
-
A survivor of the migrant trailer: ‘They couldn’t breathe’
Shutterstock
Photo Credit: thetahoeguy / Shutterstock
- Foreign-born population share: 39.1%
- Most common country of origin: China
- Total foreign-born population: 775,944
- Total population: 1,985,926
Shutterstock
Photo Credit: thetahoeguy / Shutterstock
- Foreign-born population share: 39.1%
- Most common country of origin: China
- Total foreign-born population: 775,944
- Total population: 1,985,926
-
A survivor of the migrant trailer: ‘They couldn’t breathe’
Shutterstock
Photo Credit: Just dance / Shutterstock
- Foreign-born population share: 40.9%
- Most common country of origin: Cuba
- Total foreign-born population: 2,504,666
- Total population: 6,129,858
Shutterstock
Photo Credit: Just dance / Shutterstock
- Foreign-born population share: 40.9%
- Most common country of origin: Cuba
- Total foreign-born population: 2,504,666
- Total population: 6,129,858
