
New website helps you imagine what extreme climate change could do to your home
HAROLD POSTIC/AFP via Getty Images
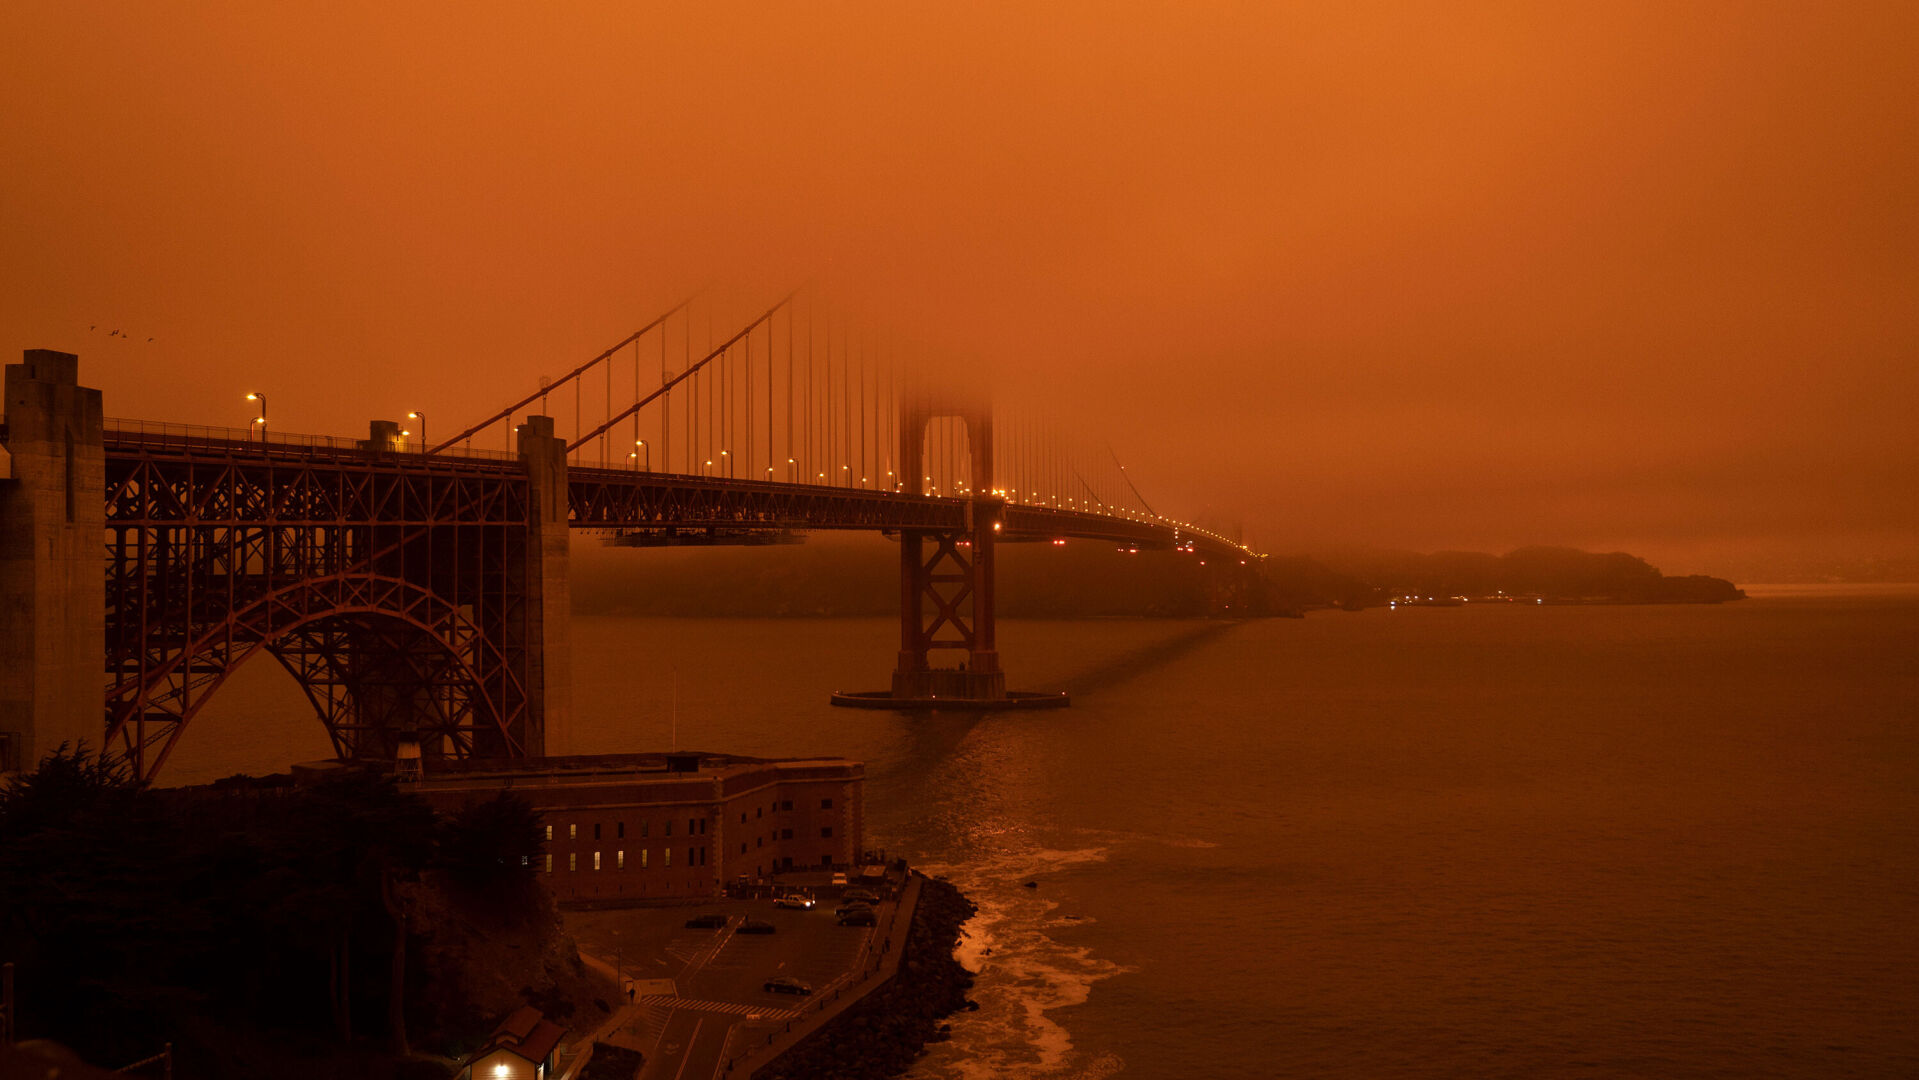
ThisClimateDoesNotExist.com allows you to look up any address and get a surprisingly realistic sense of what it could look like if that place was struck by flood, wildfires or smog. Cars are shown here driving along the Golden Gate Bridge under an orange smoke filled sky at midday in San Francisco, California on September 9, 2020.
The other day I found myself looking at a startling image of my Northern California home, the daylight dampened by an eerie orange glow as wildfire smoke blocked the sun.
It looked exactly as it had on Sept. 9, 2020, when the entire San Francisco Bay Area was shrouded in orange smoke — a scary scene I hoped I’d never see again. But this time the disturbing sight was generated by a new website with the help of artificial intelligence. The goal: to draw attention to the perils of our changing environment, and inspire people to take action against it, by showing how climate disasters would look in our own backyards.
On ThisClimateDoesNotExist.com you can look up any address — your house, landmarks like the Arc de Triomphe in Paris, Times Square in New York or San Francisco’s “Painted Ladies” homes — and get a surprisingly realistic sense of what it could look like if that place was struck by flood, wildfires or smog. The website, which does this by using AI trained on images of such scenes to re-imagine pictures from Google Street View, was created by researchers at Mila, an AI research institute in Montreal.
The website, which was unveiled Thursday, has been in the works for two years. It began with the realization that while we have tools to face climate change, an enormous obstacle to dealing with it is public awareness and political will, said Yoshua Bengio, a professor at the University of Montreal and founder of Mila, who also led the research team for the project. Bengio, a Turing Award winner, said the researchers wanted to create images that felt personal, which led to the idea of using AI to show what your house might look like during an environmental catastrophe.
“Citizens in the past have been hearing about climate change coming from scientists, reports, and graphs,” Bengio said. “And there is a cognitive aspect, which is, something doesn’t scare us so much if it’s not right in front of our eyes.”
Climate scientists reported in August the world is already around 1.2 degrees Celsius warmer than pre-industrial levels. Temperatures should stay below 1.5 degrees, they say — a critical threshold to avoid the most severe impacts of the climate crisis. With every fraction of a degree of warming, the consequences of climate change worsen. Even limiting warming to 1.5 degrees, scientists say the kinds of extreme weather the world experienced this summer, including flash floods and more devastating hurricanes, will become more severe and more frequent.
ThisClimateDoesNotExist can show you such images that make your home or, say, the Leaning Tower of Pisa appear to be truly flooded or covered in smoke or smog. But creating these visuals isn’t as simple as placing an image of water in front of a building or adding a diaphanous filter.
There aren’t many pairs of images out there showing homes before and after a flood — the kind of data that would be helpful for training an AI system on the relationship between the image it’s being fed and what it should turn it into. To compensate for this, researchers started by building a computerized virtual world. This world, the equivalent of several blocks of a city, let them control flooding and other elements so they could create synthetic images of places “before” and “after” a climate catastrophe, said Sasha Luccioni, a postdoctoral researcher at the University of Montreal and Mila and a lead researcher on the project.
This synthetic data, along with real images showing flooded houses and pictures of smokey orange skies and smog, was used to train an AI system to take any given image from Google Street View and make it look like a climate catastrophe was at hand. To do this, the system needed to first learn where, for instance, water should go in a given image, and then essentially paint water in a realistic-looking way, including reflections of objects poking out of the water and considerations for the lighting of the image.
After a user types in an address and ThisClimateDoesNotExist generates images, the website encourages the user to share them with others and presents resources to learn more about climate change and fight it.
“I think what we want is to channel that initial, like, ‘Oh man, my house is underwater,’ into climate action,” Luccioni said.
— CNN’s Rachel Ramirez contributed to this report.
***
-
Major cities with the biggest projected temperature changes by 2050tradville // Shutterstock
September 2020 was the hottest recorded month worldwide, with 2020 representing the second-hottest year ever recorded. Every one of the top-five hottest years have occurred since 2015.
From meteorologists to ecologists, researchers are closely monitoring the effects of climate change and using that data to help better predict changes to come. Chief among those effects are temperature swings: Winters and summers are expected to be warmer in virtually every city by 2050. But just how extreme those increases will be varies by location.
Nestpick ranked 20 cities facing the biggest temperature increases in the next 30 years. The rankings come from Nestpick's own study that looks at how climate change is projected to affect 85 cities around the world by 2050. Findings reveal which cities are most vulnerable when it comes to potential sea-level rise, temperature increases, water shortages, and even which income levels will be most affected. Ties were broken by the projected average annual temperature in 2050. Cities are listed from lowest temperature increase (#20) to highest (#1).
Even small average temperature increases can wreak havoc on local economies, culture, and ecology. Baked into averages are more aggressive weather events and "weather whiplash," from droughts and wildfires to heavy rainstorms and flooding. Higher temperatures mean bigger energy bills and potential for power outages, while persistent heat waves and droughts spell trouble for agriculture and fish populations.
These scenarios, while already underway, assume that fossil fuels are burned at the same rate. Mitigation efforts could avoid worst-case scenarios, while infrastructure plans in cities will help manage the effects if they should come to full fruition. Keep reading to learn more about the 20 cities globally with the biggest projected temperature increases by 2050.
tradville // ShutterstockSeptember 2020 was the hottest recorded month worldwide, with 2020 representing the second-hottest year ever recorded. Every one of the top-five hottest years have occurred since 2015.
From meteorologists to ecologists, researchers are closely monitoring the effects of climate change and using that data to help better predict changes to come. Chief among those effects are temperature swings: Winters and summers are expected to be warmer in virtually every city by 2050. But just how extreme those increases will be varies by location.
Nestpick ranked 20 cities facing the biggest temperature increases in the next 30 years. The rankings come from Nestpick's own study that looks at how climate change is projected to affect 85 cities around the world by 2050. Findings reveal which cities are most vulnerable when it comes to potential sea-level rise, temperature increases, water shortages, and even which income levels will be most affected. Ties were broken by the projected average annual temperature in 2050. Cities are listed from lowest temperature increase (#20) to highest (#1).
Even small average temperature increases can wreak havoc on local economies, culture, and ecology. Baked into averages are more aggressive weather events and "weather whiplash," from droughts and wildfires to heavy rainstorms and flooding. Higher temperatures mean bigger energy bills and potential for power outages, while persistent heat waves and droughts spell trouble for agriculture and fish populations.
These scenarios, while already underway, assume that fossil fuels are burned at the same rate. Mitigation efforts could avoid worst-case scenarios, while infrastructure plans in cities will help manage the effects if they should come to full fruition. Keep reading to learn more about the 20 cities globally with the biggest projected temperature increases by 2050.
-
Major cities with the biggest projected temperature changes by 2050JPL Designs // Shutterstock
- Projected temperature shift (1970–2050): +4.6 F (+2.6 C)
- Average annual temperature (1970–2000): 51.9 F (11 C)
- Projected average annual temperature in 2050: 56.5 F (13.6 C)
The Pacific Northwestern United States is known for its mild climate. Summer high temperatures average around 72 degrees Fahrenheit, but it’s estimated that the city will see more and more 90-degree (32.2 C) days in the years to come. Heat can be deadly, particularly for the elderly—and especially in a city where infrastructure isn’t already in place to support cooling off its residents. Meanwhile, sea levels in Seattle have risen 6 inches over the past century and are expected to rise 10 more inches by 2050.
JPL Designs // Shutterstock- Projected temperature shift (1970–2050): +4.6 F (+2.6 C)
- Average annual temperature (1970–2000): 51.9 F (11 C)
- Projected average annual temperature in 2050: 56.5 F (13.6 C)
The Pacific Northwestern United States is known for its mild climate. Summer high temperatures average around 72 degrees Fahrenheit, but it’s estimated that the city will see more and more 90-degree (32.2 C) days in the years to come. Heat can be deadly, particularly for the elderly—and especially in a city where infrastructure isn’t already in place to support cooling off its residents. Meanwhile, sea levels in Seattle have risen 6 inches over the past century and are expected to rise 10 more inches by 2050.
-
-
Major cities with the biggest projected temperature changes by 2050Marcio Jose Bastos Silva // Shutterstock
- Projected temperature shift (1970–2050): +4.7 F (+2.6 C)
- Average annual temperature (1970–2000): 50.5 F (10.3 C)
- Projected average annual temperature in 2050: 55.2 F (12.9 C)
On the other side of the United States, Boston is also heating up as sea levels rise. It ranks 21st in the world for worst sea level rise, with 6 more inches expected in the next 15 years alone. The city is focusing on preparing their waterfronts by restoring marshes in waterfront parks and encouraging flood-resistant developments. It’s not totally clear why Boston and the rest of New England are slated to get disproportionately warmer under climate change, but climatologists suspect it relates to warming seas and its location related to the jet stream and Gulf Stream.
Marcio Jose Bastos Silva // Shutterstock- Projected temperature shift (1970–2050): +4.7 F (+2.6 C)
- Average annual temperature (1970–2000): 50.5 F (10.3 C)
- Projected average annual temperature in 2050: 55.2 F (12.9 C)
On the other side of the United States, Boston is also heating up as sea levels rise. It ranks 21st in the world for worst sea level rise, with 6 more inches expected in the next 15 years alone. The city is focusing on preparing their waterfronts by restoring marshes in waterfront parks and encouraging flood-resistant developments. It’s not totally clear why Boston and the rest of New England are slated to get disproportionately warmer under climate change, but climatologists suspect it relates to warming seas and its location related to the jet stream and Gulf Stream.
-
Major cities with the biggest projected temperature changes by 2050Olha Volynska // Shutterstock
- Projected temperature shift (1970–2050): +5.1 F (+2.8 C)
- Average annual temperature (1970–2000): 41.7 F (5.4 C)
- Projected average annual temperature in 2050: 46.8 F (8.2 C)
The coldest city on this list, by 2050 Helsinki will be about as warm as Kiev—700 miles to the South—is today. Helsinki is doing its part to prevent global warming and has committed to becoming carbon-neutral by 2035, reducing its carbon emissions by 80%. The city is most concerned about floods and extreme winter conditions and is already ramping up for city-led adaptation strategies like improving stormwater management for floods and improving the cooling of homes for heatwaves.
Olha Volynska // Shutterstock- Projected temperature shift (1970–2050): +5.1 F (+2.8 C)
- Average annual temperature (1970–2000): 41.7 F (5.4 C)
- Projected average annual temperature in 2050: 46.8 F (8.2 C)
The coldest city on this list, by 2050 Helsinki will be about as warm as Kiev—700 miles to the South—is today. Helsinki is doing its part to prevent global warming and has committed to becoming carbon-neutral by 2035, reducing its carbon emissions by 80%. The city is most concerned about floods and extreme winter conditions and is already ramping up for city-led adaptation strategies like improving stormwater management for floods and improving the cooling of homes for heatwaves.
-
-
Major cities with the biggest projected temperature changes by 2050justoomm // Shutterstock
- Projected temperature shift (1970–2050): +5.1 F (+2.9 C)
- Average annual temperature (1970–2000): 41.7 F (5.4 C)
- Projected average annual temperature in 2050: 46.8 F (8.2 C)
With oceans warming and glaciers melting, St. Petersburg has long been prone to floods from rising sea levels. Construction on a $3.85 billion floodgate across the Gulf of Finland was begun in 1979 to protect the historic city and UNESCO World Heritage Site from storm surges. The project was not completed until 2011 and has held since, but officials noted that the Neva Bay is freezing over later each year which increases the chance for early winter storm surges.
justoomm // Shutterstock- Projected temperature shift (1970–2050): +5.1 F (+2.9 C)
- Average annual temperature (1970–2000): 41.7 F (5.4 C)
- Projected average annual temperature in 2050: 46.8 F (8.2 C)
With oceans warming and glaciers melting, St. Petersburg has long been prone to floods from rising sea levels. Construction on a $3.85 billion floodgate across the Gulf of Finland was begun in 1979 to protect the historic city and UNESCO World Heritage Site from storm surges. The project was not completed until 2011 and has held since, but officials noted that the Neva Bay is freezing over later each year which increases the chance for early winter storm surges.
-
Major cities with the biggest projected temperature changes by 2050Balate Dorin // Shutterstock
- Projected temperature shift (1970–2050): +5.2 F (+2.9 C)
- Average annual temperature (1970–2000): 66.8 F (19.3 C)
- Projected average annual temperature in 2050: 72 F (22.2 C)
The first inland city to make the list, this urban center in northwest Africa is already warm and getting warmer. Rising temperatures in Morocco are expected to bring increased drought and decreases in water supplies for residents. Rainfall is expected to drop at least 18% and snow cover at least 38%, which would significantly deplete groundwater stores. Marrakesh hosted the 2016 United Nations Climate Change Conference, the first meeting after the Paris Agreement of 2015.
Balate Dorin // Shutterstock- Projected temperature shift (1970–2050): +5.2 F (+2.9 C)
- Average annual temperature (1970–2000): 66.8 F (19.3 C)
- Projected average annual temperature in 2050: 72 F (22.2 C)
The first inland city to make the list, this urban center in northwest Africa is already warm and getting warmer. Rising temperatures in Morocco are expected to bring increased drought and decreases in water supplies for residents. Rainfall is expected to drop at least 18% and snow cover at least 38%, which would significantly deplete groundwater stores. Marrakesh hosted the 2016 United Nations Climate Change Conference, the first meeting after the Paris Agreement of 2015.
-
-
Major cities with the biggest projected temperature changes by 2050Francesco Ferrarini // Shutterstock
- Projected temperature shift (1970–2050): +5.3 F (+3 C)
- Average annual temperature (1970–2000): 53.6 F (12 C)
- Projected average annual temperature in 2050: 58.9 F (15 C)
The mayor’s office in New York City has been officially preparing for climate change since 2009, when the New York City Panel on Climate Change first convened. The city is preparing for increased heat, rainfall and flood events, and has begun reconstruction of coastlines to protect them from erosion. The panel announced the city’s official climate strategy in April 2019, which includes coastal infrastructure and community investments.
Francesco Ferrarini // Shutterstock- Projected temperature shift (1970–2050): +5.3 F (+3 C)
- Average annual temperature (1970–2000): 53.6 F (12 C)
- Projected average annual temperature in 2050: 58.9 F (15 C)
The mayor’s office in New York City has been officially preparing for climate change since 2009, when the New York City Panel on Climate Change first convened. The city is preparing for increased heat, rainfall and flood events, and has begun reconstruction of coastlines to protect them from erosion. The panel announced the city’s official climate strategy in April 2019, which includes coastal infrastructure and community investments.
-
Major cities with the biggest projected temperature changes by 2050Travel Faery // Shutterstock
- Projected temperature shift (1970–2050): +5.4 F (+3 C)
- Average annual temperature (1970–2000): 46.3 F (7.9 C)
- Projected average annual temperature in 2050: 51.7 F (10.9 C)
Top of mind in Kiev and surrounding areas is what effects warming temperatures and drought will have on agriculture. Ukraine lost an estimated 1.4 million acres of winter crops such as wheat to drought last winter, after rainfall dropped to 8% below normal. 2019 broke local records for the hottest year on record in Kiev, only to be outdone by 2020. The city broke 36 different temperature records that year, including 12 in March.
Travel Faery // Shutterstock- Projected temperature shift (1970–2050): +5.4 F (+3 C)
- Average annual temperature (1970–2000): 46.3 F (7.9 C)
- Projected average annual temperature in 2050: 51.7 F (10.9 C)
Top of mind in Kiev and surrounding areas is what effects warming temperatures and drought will have on agriculture. Ukraine lost an estimated 1.4 million acres of winter crops such as wheat to drought last winter, after rainfall dropped to 8% below normal. 2019 broke local records for the hottest year on record in Kiev, only to be outdone by 2020. The city broke 36 different temperature records that year, including 12 in March.
-
-
Major cities with the biggest projected temperature changes by 2050Sergey Novikov // Shutterstock
- Projected temperature shift (1970–2050): +5.4 F (+3 C)
- Average annual temperature (1970–2000): 56.1 F (13.4 C)
- Projected average annual temperature in 2050: 61.5 F (16.4 C)
The temperature projections for Washington D.C. are expected to double, if not triple, the number of dangerously hot days the city sees each summer by 2050. Although the U.S. Capital is about 30 miles inland from the Chesapeake Bay and 100 miles from the open ocean, it borders two tidal rivers, the Potomac and Anacostia, which are susceptible to sea-level rise. The two water bodies rose 11 inches in the past 90 years, and are expected to rise 3.4 more feet by 2080. Several underground Metro rail stations already experience flooding, and above-ground transit stations are at risk from storms and extreme heat.
Sergey Novikov // Shutterstock- Projected temperature shift (1970–2050): +5.4 F (+3 C)
- Average annual temperature (1970–2000): 56.1 F (13.4 C)
- Projected average annual temperature in 2050: 61.5 F (16.4 C)
The temperature projections for Washington D.C. are expected to double, if not triple, the number of dangerously hot days the city sees each summer by 2050. Although the U.S. Capital is about 30 miles inland from the Chesapeake Bay and 100 miles from the open ocean, it borders two tidal rivers, the Potomac and Anacostia, which are susceptible to sea-level rise. The two water bodies rose 11 inches in the past 90 years, and are expected to rise 3.4 more feet by 2080. Several underground Metro rail stations already experience flooding, and above-ground transit stations are at risk from storms and extreme heat.
-
Major cities with the biggest projected temperature changes by 2050Scott Heaney // Shutterstock
- Projected temperature shift (1970–2050): +5.4 F (+3 C)
- Average annual temperature (1970–2000): 47.1 F (8.4 C)
- Projected average annual temperature in 2050: 52.6 F (11.4 C)
Toronto officially declared a climate emergency in October 2019. The city began mobilizing communities to prepare for the future with a Sustainable Neighborhood Action Plan (SNAP). SNAP is already helping homeowners and businesses retrofit their properties and neighborhoods, assisting with projects like rainwater collection to reduce water use and planting trees and other vegetation to shade homes and reduce the heat island effects of the city.
Scott Heaney // Shutterstock- Projected temperature shift (1970–2050): +5.4 F (+3 C)
- Average annual temperature (1970–2000): 47.1 F (8.4 C)
- Projected average annual temperature in 2050: 52.6 F (11.4 C)
Toronto officially declared a climate emergency in October 2019. The city began mobilizing communities to prepare for the future with a Sustainable Neighborhood Action Plan (SNAP). SNAP is already helping homeowners and businesses retrofit their properties and neighborhoods, assisting with projects like rainwater collection to reduce water use and planting trees and other vegetation to shade homes and reduce the heat island effects of the city.
-
-
Major cities with the biggest projected temperature changes by 2050ZGPhotography // Shutterstock
- Projected temperature shift (1970–2050): +5.5 F (+3 C)
- Average annual temperature (1970–2000): 52.2 F (11.2 C)
- Projected average annual temperature in 2050: 57.7 F (14.3 C)
Budapest forms a major heat island, with temperatures in the city center averaging 2.7 degrees Fahrenheit (1.5 C) warmer than the outskirts. Temperatures have already risen by that amount since 1970, and are continuing to rise even more. The city is working on its green infrastructure in hopes that pocket parks, which increase the amount of green space per capita, will cool off the heat island as well as mitigate air pollution.
ZGPhotography // Shutterstock- Projected temperature shift (1970–2050): +5.5 F (+3 C)
- Average annual temperature (1970–2000): 52.2 F (11.2 C)
- Projected average annual temperature in 2050: 57.7 F (14.3 C)
Budapest forms a major heat island, with temperatures in the city center averaging 2.7 degrees Fahrenheit (1.5 C) warmer than the outskirts. Temperatures have already risen by that amount since 1970, and are continuing to rise even more. The city is working on its green infrastructure in hopes that pocket parks, which increase the amount of green space per capita, will cool off the heat island as well as mitigate air pollution.
-
Major cities with the biggest projected temperature changes by 2050Lee Jung Tak // Shutterstock
- Projected temperature shift (1970–2050): +5.5 F (+3.1 C)
- Average annual temperature (1970–2000): 43.7 F (6.5 C)
- Projected average annual temperature in 2050: 49.2 F (9.5 C)
Ottawa pledged in 2020 to commit $100 million to reduce the oil and gas industry's greenhouse gas emissions by 100 megatons by 2033. The city is bracing for more heat-related illnesses in the summer, home damage and power outages from more frequent severe storms, strained sewer systems from increased rainfall, and damage to roads and other infrastructure from more frequent freeze-thaw cycles. Spring floods are of particular concern to property owners. Ottawa's government rolled out an ambitious goal of reaching zero greenhouse gas emissions by 2050.
Lee Jung Tak // Shutterstock- Projected temperature shift (1970–2050): +5.5 F (+3.1 C)
- Average annual temperature (1970–2000): 43.7 F (6.5 C)
- Projected average annual temperature in 2050: 49.2 F (9.5 C)
Ottawa pledged in 2020 to commit $100 million to reduce the oil and gas industry's greenhouse gas emissions by 100 megatons by 2033. The city is bracing for more heat-related illnesses in the summer, home damage and power outages from more frequent severe storms, strained sewer systems from increased rainfall, and damage to roads and other infrastructure from more frequent freeze-thaw cycles. Spring floods are of particular concern to property owners. Ottawa's government rolled out an ambitious goal of reaching zero greenhouse gas emissions by 2050.
-
-
Major cities with the biggest projected temperature changes by 2050Oleksiy Mark // Shutterstock
- Projected temperature shift (1970–2050): +5.5 F (+3.1 C)
- Average annual temperature (1970–2000): 44 F (6.7 C)
- Projected average annual temperature in 2050: 49.5 F (9.7 C)
Officials in Stockholm estimated in 2010 that a mean annual temperature shift of 4 degrees Celsius would increase total summer mortality by 5% from heat waves and increases in infectious diseases, though there may be a parallel drop in cold-induced deaths in winter as it warms. Sweden is working toward carbon neutrality, aiming for a 100% reduction in emissions by 2040. Sea levels in the Baltic Sea around Stockholm have risen, but the land has been rising just as fast as it decompresses after becoming ice-free which has kept the coastlines dry.
Oleksiy Mark // Shutterstock- Projected temperature shift (1970–2050): +5.5 F (+3.1 C)
- Average annual temperature (1970–2000): 44 F (6.7 C)
- Projected average annual temperature in 2050: 49.5 F (9.7 C)
Officials in Stockholm estimated in 2010 that a mean annual temperature shift of 4 degrees Celsius would increase total summer mortality by 5% from heat waves and increases in infectious diseases, though there may be a parallel drop in cold-induced deaths in winter as it warms. Sweden is working toward carbon neutrality, aiming for a 100% reduction in emissions by 2040. Sea levels in the Baltic Sea around Stockholm have risen, but the land has been rising just as fast as it decompresses after becoming ice-free which has kept the coastlines dry.
-
Major cities with the biggest projected temperature changes by 2050Sorbis // Shutterstock
- Projected temperature shift (1970–2050): +5.6 F (+3.1 C)
- Average annual temperature (1970–2000): 50.3 F (10.2 C)
- Projected average annual temperature in 2050: 55.9 F (13.3 C)
Like the other cities on this list, Chicago is bracing for scorching summer heat and other extreme weather events. It’s expected the area will see longer dry spells interspersed with heavy rainfall events. The city has already started planting new trees that can withstand warmer climates, installing permeable pavements to improve stormwater management, and installing green roofs and reflective roofs to cool buildings. It recently planted more than 500,000 trees over a 15-year period, and all new buildings since 2001 have had to meet the reflective roof standards.
Sorbis // Shutterstock- Projected temperature shift (1970–2050): +5.6 F (+3.1 C)
- Average annual temperature (1970–2000): 50.3 F (10.2 C)
- Projected average annual temperature in 2050: 55.9 F (13.3 C)
Like the other cities on this list, Chicago is bracing for scorching summer heat and other extreme weather events. It’s expected the area will see longer dry spells interspersed with heavy rainfall events. The city has already started planting new trees that can withstand warmer climates, installing permeable pavements to improve stormwater management, and installing green roofs and reflective roofs to cool buildings. It recently planted more than 500,000 trees over a 15-year period, and all new buildings since 2001 have had to meet the reflective roof standards.
-
-
Major cities with the biggest projected temperature changes by 2050KennStilger47 // Shutterstock
- Projected temperature shift (1970–2050): +5.6 F (+3.1 C)
- Average annual temperature (1970–2000): 58.3 F (14.6 C)
- Projected average annual temperature in 2050: 63.9 F (17.7 C)
One of the biggest climate events to get the attention of Nashville, Tennessee, residents was the flood in 2010. A record-breaking 17 inches of rainfall—13 inches in 48 hours—fell on the area, causing $2 billion in property damage and killing 11 people. Extreme rainfall patterns and flooding are expected to become increasingly common, as are high heat days during the summer months. What’s more, in a southern state like Tennessee, more warm days mean a longer mosquito season, which increases the risk of the Zika virus and other mosquito-borne illnesses.
KennStilger47 // Shutterstock- Projected temperature shift (1970–2050): +5.6 F (+3.1 C)
- Average annual temperature (1970–2000): 58.3 F (14.6 C)
- Projected average annual temperature in 2050: 63.9 F (17.7 C)
One of the biggest climate events to get the attention of Nashville, Tennessee, residents was the flood in 2010. A record-breaking 17 inches of rainfall—13 inches in 48 hours—fell on the area, causing $2 billion in property damage and killing 11 people. Extreme rainfall patterns and flooding are expected to become increasingly common, as are high heat days during the summer months. What’s more, in a southern state like Tennessee, more warm days mean a longer mosquito season, which increases the risk of the Zika virus and other mosquito-borne illnesses.
-
Major cities with the biggest projected temperature changes by 2050R.M. Nunes // Shutterstock
- Projected temperature shift (1970–2050): +5.8 F (+3.2 C)
- Average annual temperature (1970–2000): 44.4 F (6.9 C)
- Projected average annual temperature in 2050: 50.2 F (10.1 C)
Canada as a whole is expected to bear twice the global rate of warming as the rest of the world, and Montréal is another city expecting longer summers and shorter winters. As part of its 2020–2030 climate plan, the city aims to plant 500,000 trees and protect 10% of the territory’s land in order to decrease climate vulnerability and reduce the area of the city’s worst heat islands.
R.M. Nunes // Shutterstock- Projected temperature shift (1970–2050): +5.8 F (+3.2 C)
- Average annual temperature (1970–2000): 44.4 F (6.9 C)
- Projected average annual temperature in 2050: 50.2 F (10.1 C)
Canada as a whole is expected to bear twice the global rate of warming as the rest of the world, and Montréal is another city expecting longer summers and shorter winters. As part of its 2020–2030 climate plan, the city aims to plant 500,000 trees and protect 10% of the territory’s land in order to decrease climate vulnerability and reduce the area of the city’s worst heat islands.
-
-
Major cities with the biggest projected temperature changes by 2050Ketkar // Shutterstock
- Projected temperature shift (1970–2050): +5.8 F (+3.2 C)
- Average annual temperature (1970–2000): 53.9 F (12.2 C)
- Projected average annual temperature in 2050: 59.7 F (15.4 C)
Philadelphia expects hotter temperatures and more rainfall to be its biggest concerns in the near future. A 2015 study from the Philadelphia Department of Public Health found that some areas of the city can be up to 22 degrees (12.2 C) hotter than other neighborhoods. More precipitation means more rain in summer and snow in winter, as well as more extreme storms, hurricanes, and flooding. The city’s climate adaptation plan includes engaging citizens and support for local food networks.
Ketkar // Shutterstock- Projected temperature shift (1970–2050): +5.8 F (+3.2 C)
- Average annual temperature (1970–2000): 53.9 F (12.2 C)
- Projected average annual temperature in 2050: 59.7 F (15.4 C)
Philadelphia expects hotter temperatures and more rainfall to be its biggest concerns in the near future. A 2015 study from the Philadelphia Department of Public Health found that some areas of the city can be up to 22 degrees (12.2 C) hotter than other neighborhoods. More precipitation means more rain in summer and snow in winter, as well as more extreme storms, hurricanes, and flooding. The city’s climate adaptation plan includes engaging citizens and support for local food networks.
-
Major cities with the biggest projected temperature changes by 2050Rostislav Ageev // Shutterstock
- Projected temperature shift (1970–2050): +5.8 F (+3.3 C)
- Average annual temperature (1970–2000): 61.4 F (16.4 C)
- Projected average annual temperature in 2050: 67.3 F (19.6 C)
A hotter, drier future is in store for the already arid landscape of Jerusalem. Warming temperatures and decreases in precipitation—as much as 25% by the end of the century—threaten water sources for the region. More extreme climate conditions could dramatically worsen living conditions for residents in nearby conflict zones.
Rostislav Ageev // Shutterstock- Projected temperature shift (1970–2050): +5.8 F (+3.3 C)
- Average annual temperature (1970–2000): 61.4 F (16.4 C)
- Projected average annual temperature in 2050: 67.3 F (19.6 C)
A hotter, drier future is in store for the already arid landscape of Jerusalem. Warming temperatures and decreases in precipitation—as much as 25% by the end of the century—threaten water sources for the region. More extreme climate conditions could dramatically worsen living conditions for residents in nearby conflict zones.
-
-
Major cities with the biggest projected temperature changes by 2050Jon Bilous // Shutterstock
- Projected temperature shift (1970–2050): +6 F (+3.4 C)
- Average annual temperature (1970–2000): 55.5 F (13.1 C)
- Projected average annual temperature in 2050: 61.6 F (16.4 C)
Baltimore is bracing for it all: extreme temps, floods, droughts, storms, rising seas, heat waves, and high energy demands. The city’s Disaster Preparedness and Planning Project (DP3) was launched in 2013 to lead the efforts in creating a more resilient city. High tides already breach the popular Inner Harbor area, cutting off access to its businesses. By 2045, it’s expected these high tide flood events will be 10 times more common.
Jon Bilous // Shutterstock- Projected temperature shift (1970–2050): +6 F (+3.4 C)
- Average annual temperature (1970–2000): 55.5 F (13.1 C)
- Projected average annual temperature in 2050: 61.6 F (16.4 C)
Baltimore is bracing for it all: extreme temps, floods, droughts, storms, rising seas, heat waves, and high energy demands. The city’s Disaster Preparedness and Planning Project (DP3) was launched in 2013 to lead the efforts in creating a more resilient city. High tides already breach the popular Inner Harbor area, cutting off access to its businesses. By 2045, it’s expected these high tide flood events will be 10 times more common.
-
Major cities with the biggest projected temperature changes by 2050Christian Hinkle // Shutterstock
- Projected temperature shift (1970–2050): +6.1 F (+3.4 C)
- Average annual temperature (1970–2000): 53.3 F (11.8 C)
- Projected average annual temperature in 2050: 59.4 F (15.2 C)
It’s been written that Cincinnati is putting forward an outsized effort in the fight against climate change, but perhaps that’s because the city is at such a high risk for rising temps. In 2020, it contracted a new solar farm that will be the largest in the country. The city is aiming for 100% renewable energy by 2035—a faster goal than even Stockholm’s 100% by 2040.
Christian Hinkle // Shutterstock- Projected temperature shift (1970–2050): +6.1 F (+3.4 C)
- Average annual temperature (1970–2000): 53.3 F (11.8 C)
- Projected average annual temperature in 2050: 59.4 F (15.2 C)
It’s been written that Cincinnati is putting forward an outsized effort in the fight against climate change, but perhaps that’s because the city is at such a high risk for rising temps. In 2020, it contracted a new solar farm that will be the largest in the country. The city is aiming for 100% renewable energy by 2035—a faster goal than even Stockholm’s 100% by 2040.
-
-
Major cities with the biggest projected temperature changes by 2050RomanSlavik.com // Shutterstock
- Projected temperature shift (1970–2050): +6.4 F (+3.5 C)
- Average annual temperature (1970–2000): 49.6 F (9.8 C)
- Projected average annual temperature in 2050: 55.9 F (13.3 C)
Topping this list is Ljubljana, the largest city and capital of Slovenia. It’s the fastest-warming city in the world, thanks to its topographical position in a basin that leads to weak air circulation with the surrounding landscape. The city is already rather small and loaded with green spaces, which will keep its warming from being even greater. The city government reported in 2019 that it has implemented 2,000 different projects to care for the environment, including planting 50,000 trees, energy efficient building renovations and more.
This story was produced and distributed in partnership with Stacker Studio.
RomanSlavik.com // Shutterstock- Projected temperature shift (1970–2050): +6.4 F (+3.5 C)
- Average annual temperature (1970–2000): 49.6 F (9.8 C)
- Projected average annual temperature in 2050: 55.9 F (13.3 C)
Topping this list is Ljubljana, the largest city and capital of Slovenia. It’s the fastest-warming city in the world, thanks to its topographical position in a basin that leads to weak air circulation with the surrounding landscape. The city is already rather small and loaded with green spaces, which will keep its warming from being even greater. The city government reported in 2019 that it has implemented 2,000 different projects to care for the environment, including planting 50,000 trees, energy efficient building renovations and more.
This story was produced and distributed in partnership with Stacker Studio.
Categories: Trending