CABO SAN LUCAS, Mexico (AP) — Hurricane Hilary headed for Mexico’s Baja California on Saturday as the U.S. National Hurricane Center predicted “catastrophic and life-threatening flooding” for the peninsula and for the southwestern United States, where it was forecast to cross the border as a tropical storm on Sunday.
Officials as far north as Los Angeles scrambled to get the homeless off the streets, set up shelters and prepare for evacuations.
Hilary is expected to plow into Mexico’s Baja peninsula on Saturday night and then surge northward and enter the history books as the first tropical storm to hit Southern California in 84 years.
The U.S. National Hurricane Center issued tropical storm and potential flood warnings for a wide swath of Southern California from the Pacific coast to interior mountains and deserts. Officials talked of evacuation plans for California’s Catalina Island.
“I don’t think any of us — I know me particularly — never thought I’d be standing here talking about a hurricane or a tropical storm,” said Janice Hahn, chair of the Los Angeles County Board of Supervisors.
After rapidly gaining power early Friday, Hilary slowed some later in the day but remained a major Category 3 hurricane early Saturday with maximum sustained winds of 125 mph (205 kph), down from 145 mph (230 kph).
Uncredited – hogp, ASSOCIATED PRESS
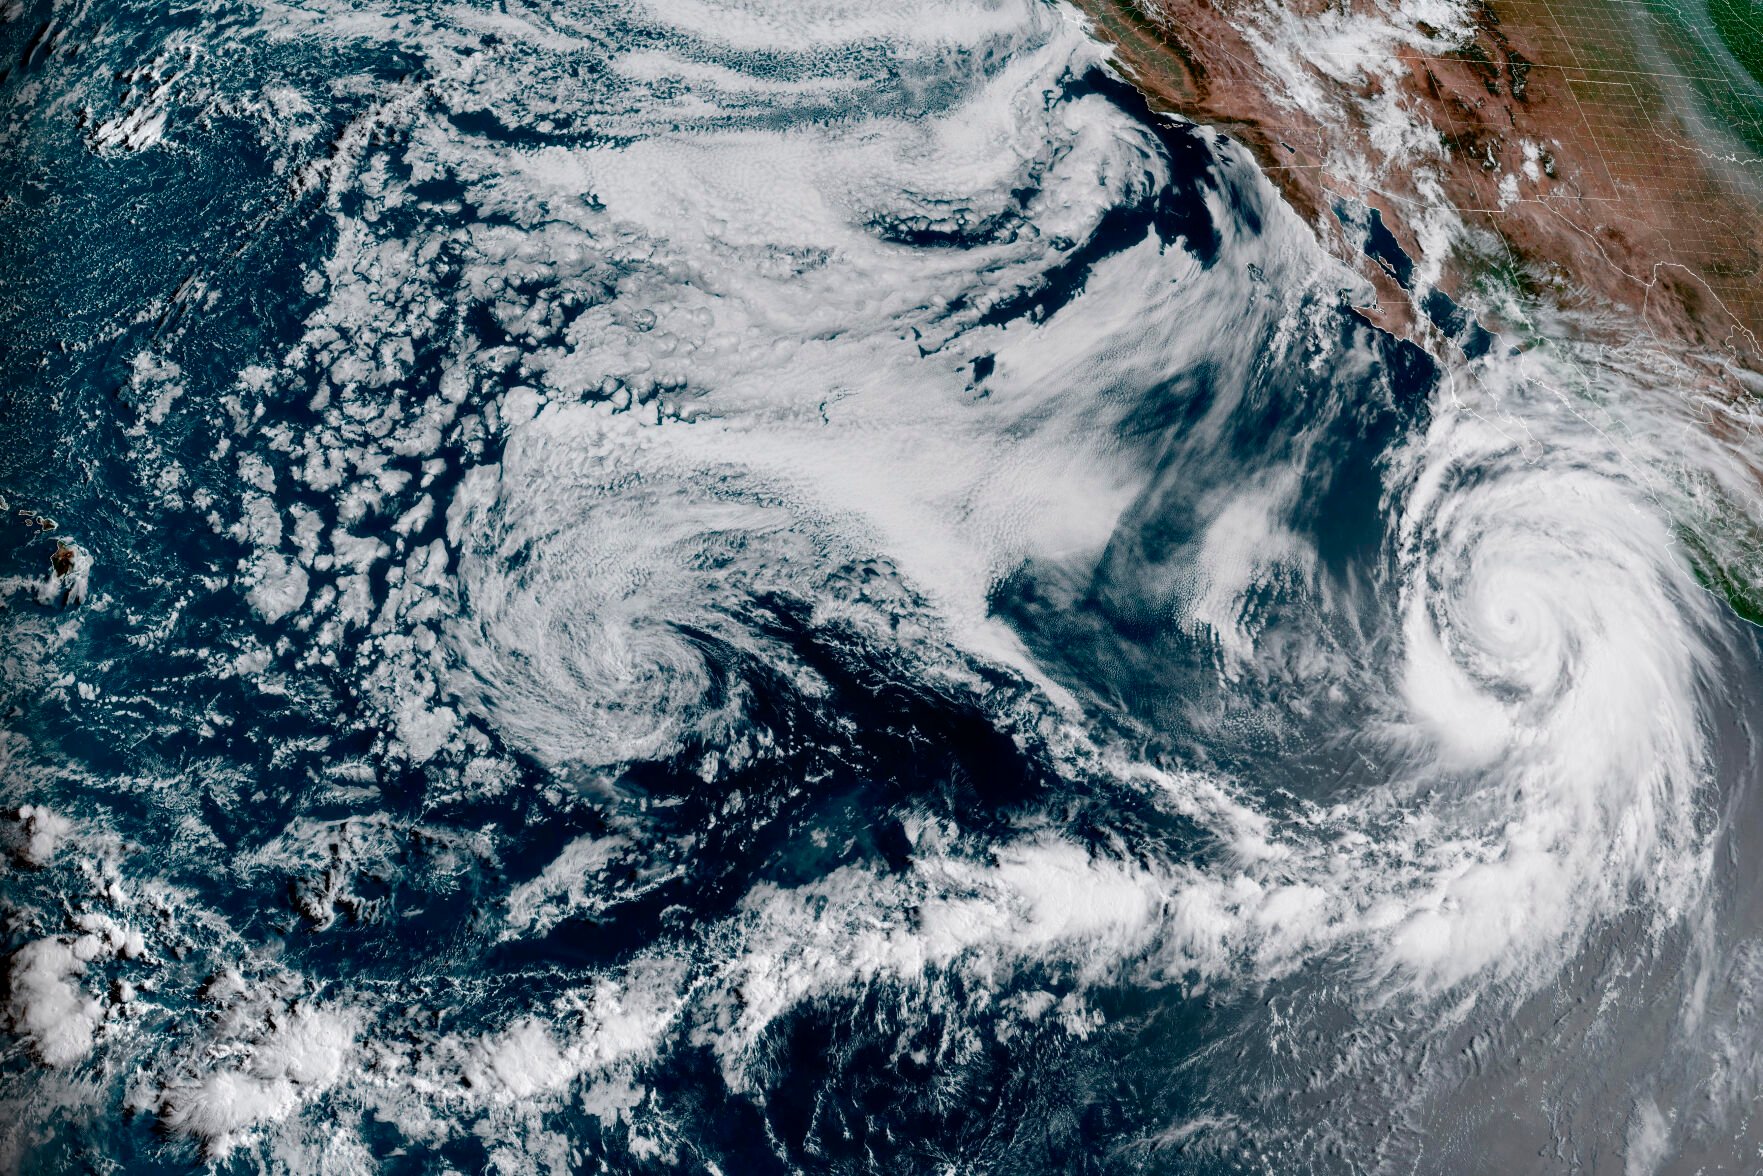
This Friday, Aug. 18, 2023, 1:10 p.m. EDT satellite image provided by the National Oceanic and Atmospheric Administration shows Hurricane Hilary, right, off Mexico’s Pacific coast. It grew rapidly to Category 4 strength and could reach Southern California as the first tropical storm there in 84 years, causing “significant and rare impacts” including extensive flooding. The U.S. National Hurricane Center said a tropical storm watch has been issued for Southern California, the first time it has ever done that.
Early on Saturday, the storm was centered about 235 miles (375 kilometers) west of the southern tip of the Baja peninsula. It was moving north-northwest at 16 mph (26 kph) and was expected to turn more toward the north and pick up speed.
The latest forecast track pointed to Hilary making landfall along a sparsely populated area of the Baja peninsula at a point about 200 miles (330 kilometers) south of the Pacific port city of Ensenada.
It is then expected to continue northward up the peninsula, raising fears that its heavy rains could cause dangerous flooding in the border city of Tijuana, where many homes in the city of 1.9 million cling precariously to steep hillsides.
Mayor Montserrat Caballero Ramirez said the city was setting up four shelters in high-risk zones and warning people in risky zones.
“We are a vulnerable city being on one of the most visited borders in the world and because of our landscape,” she said.
Concern was rising in the U.S., too.
The National Park Service closed Joshua Tree National Park and Mojave National Preserve to keep people from becoming stranded amid flooding. Cities across the region, including in Arizona, were offering sandbags to safeguard properties against floodwaters. Major League Baseball rescheduled three Sunday games in Southern California, moving them to Saturday as part of split-doubleheaders,
Deputies with the Los Angeles Sheriff’s Department took to the road to urge homeless people living in riverbeds to seek shelter. Authorities in the city were arranging food, cots and shelters for people who needed them.
SpaceX delayed the launch of a satellite-carrying rocket from a base on California’s central coast until at least Monday. The company said conditions in the Pacific could make it difficult for a ship to recover the rocket booster.
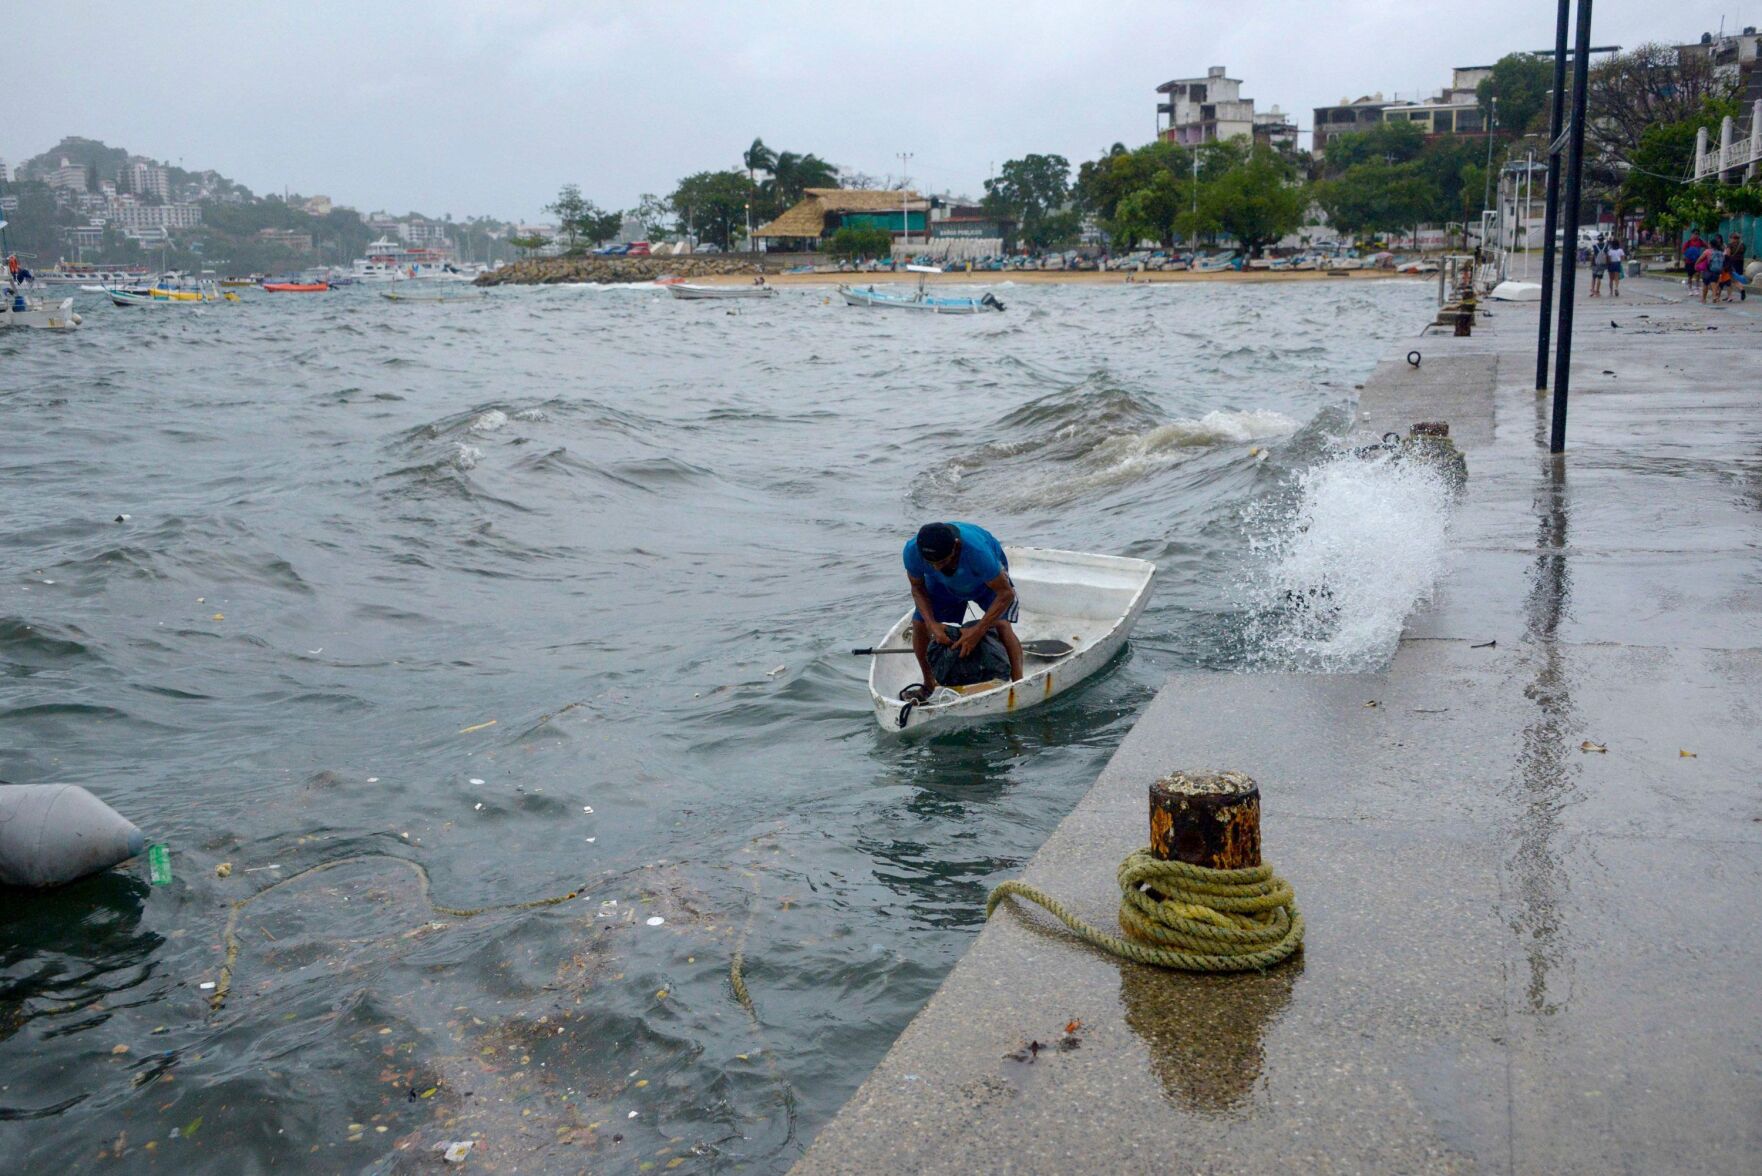
Francisco Robles, AFP/Getty Images
A man moors his boat in Acapulco, Guerrero State, Mexico, as then-tropical storm Hilary churns in the Pacific Ocean on Wednesday. Hurricane Hilary has grown rapidly to Category 4 strength and could reach Southern California as the first tropical storm there in 84 years.
President Joe Biden said the Federal Emergency Management Agency had pre-positioned staff and supplies in the region.
“I urge everyone, everyone in the path of this storm, to take precautions and listen to the guidance of state and local officials,” Biden told reporters Friday at Camp David, where he is meeting with the leaders of Japan and South Korea.
Officials in Southern California were re-enforcing sand berms, built to protect low-lying coastal communities against winter surf, like in Huntington Beach, which dubs itself as “Surf City USA.”
In nearby Newport Beach, Tanner Atkinson waited in a line of vehicles for free sandbags at a city distribution point.
“I mean a lot of people here are excited because the waves are gonna get pretty heavy,” Atkinson said. “But I mean, it’s gonna be some rain, so usually there’s some flooding and the landslides and things like that.”
Some schools in Cabo San Lucas were being prepared as temporary shelters, and in La Paz, the picturesque capital of Baja California Sur state on the Sea of Cortez, police patrolled closed beaches to keep swimmers out of the whipped-up surf. Schools were shut down in five municipalities.
It was increasingly likely that Hilary would reach California on Sunday while still at tropical storm strength, though widespread rain was expected to begin as early as Saturday, the National Weather Service’s San Diego office said.
Hurricane officials said the storm could bring heavy rainfall to the southwestern United States, dumping 3 to 6 inches (8 to 15 centimeters) in places, with isolated amounts of up to 10 inches (25 centimeters), in portions of southern California and southern Nevada.
“Two to three inches of rainfall in Southern California is unheard of” for this time of year, said Kristen Corbosiero, a University at Albany atmospheric scientist who specializes in Pacific hurricanes. “That’s a whole summer and fall amount of rain coming in probably 6 to 12 hours.”
The region could face once-in-a-century rains and there is a good chance Nevada will break its all-time rainfall record, said meteorologist Jeff Masters of Yale Climate Connections and a former government in-flight hurricane meteorologist.
___
Watson reported from San Diego. Associated Press writers Seth Borenstein in Washington, Maria Verza and Mark Stevenson in Mexico City, John Antczak in Los Angeles, and Eugene Garcia in Newport Beach, California, contributed to this report.
-
Hurricane Hilary threatens ‘catastrophic and life-threatening’ flooding in Mexico and California
Canva
Which U.S. counties face the biggest danger from Earth's most powerful storms?
With climate experts forecasting a "borderline hyperactive" hurricane season, Gutter Gnome ranked 2023's Most Hurricane-Vulnerable Counties.
The study combined hurricane risk assessments by the National Center for Disaster Preparedness (NCDP) with 10 years of historical storm data and financial impact projections from government agencies.
See how over 300 counties might fare this hurricane season in the ranking.
-
Hurricane Hilary threatens ‘catastrophic and life-threatening’ flooding in Mexico and California
Gutter Gnome
The Big Picture
The Sunshine State might also be called the Hurricane State, as two of its counties, Broward and Palm Beach, occupy the two worst spots for hurricane risk. It's also no surprise that the Southeast has the biggest hurricane vulnerability, the ranking confirms.
In fact, the 10% most susceptible counties are made up almost entirely of only three states: Florida, South Carolina, and North Carolina. Chatham County, Georgia (No. 8), and Harris County, Texas (No. 13), are the lone exceptions in this group.
Conversely, much of New England and the Texas coast are the calmest regions. Hurricanes tend to be rare in these areas and therefore face low risk of physical and monetary damages.
Check out the rankings on each of the five worst-performing counties.
No. 1: Broward County, Florida | Overall Score: 72.70
Risk: 3
Hurricane History: 26
Financial Impact: 2
No. 2: Palm Beach County, Florida | Overall Score: 72.09
Risk: 4
Hurricane History: 26
Financial Impact: 3
No. 3: Charleston County, South Carolina | Overall Score: 68.17
Risk: 9
Hurricane History: 2
Financial Impact: 8
No. 4: Horry County, South Carolina | Overall Score: 66.31
Risk: 11
Hurricane History: 2
Financial Impact: 11
No. 5: Miami-Dade County, Florida | Overall Score: 65.10
Risk: 2
Hurricane History: 84
Financial Impact: 4
-
-
Hurricane Hilary threatens ‘catastrophic and life-threatening’ flooding in Mexico and California
Gutter Gnome
Calm Before the Storm
- Although most hurricane-vulnerable counties display equally high risk and history of hurricane activity and financial loss, some counties buck this trend. They include counties like Florence, South Carolina (No. 17), and Columbus, North Carolina (No. 22), which are rated more moderately in terms of risk by NCDP and FEMA but have experienced significantly more hurricanes over the past decade.
All Quiet on the Southern Front
- Some counties synonymous with hurricane disasters didn't rank as high — more vulnerable, that is — despite very high risk of storms and loss. Lee County, Florida (No. 36), for instance, was devastated by Hurricane Ian in 2022. Apart from one other Category 5, Irma in 2017, Lee County has had a relatively calm decade. Likewise, Orleans Parish, Louisiana (No. 61), was leveled by Hurricane Katrina. That was back in 2005 — the past 10 years have been more peaceful.
Inland ≠ Immune
- While some counties might be farther from the coast, they are not necessarily safe from hurricanes or their effects. Richland County, South Carolina (No. 112 overall), and Wake County, North Carolina (No. 93), for instance, both lie more than 100 miles from the Atlantic Coast but show above-average risk and active hurricane histories. Typical hurricanes cover an area of about 100 miles but can be as wide as 300 miles.
When It Rains, It Pours
- Although hurricanes are rare in the Middle Texas Coast, some arrive with intense force. When Hurricane Harvey crossed over the area in 2017, a record 1 trillion gallons of water fell over Harris County over four days. This is why Harris County received the highest risk assessment and financial loss estimate — from separate research entities — despite a relatively quiet decade. Prior to Harvey, Celia was the last major hurricane to hit the area — in 1970.
Costliest Counties
- Of the 10 counties with the highest expected annual financial loss from hurricanes, eight are in Florida. Collectively, those eight counties represent over $4.3 billion of losses, though actual losses often are significantly higher. Harris County, Texas (No. 13 overall) — covering Houston, the fourth largest U.S. metro area — and Charleston County, South Carolina (No. 3), make up the other two counties. Harris County leads this entire group and represents potential losses greater than $1.1 billion.
Categorically Catastrophic
- Over the past decade, four states — Florida, Georgia, North Carolina, and South Carolina — each have been hit or affected by four Category 5 hurricanes between 2013 and 2022, the most among all the counties the study ranked. However, only one Georgia county, Chatham (No. 8 overall), was effectively impacted by a Category 5 storm.
Geographic Differences
- Honolulu County, Hawaii (No. 53 overall), is the only Pacific county in the ranking and registered the most hurricane activity, with 12 in the past 10 years. In this region, hurricanes — as tropical cyclones are known on the Atlantic Coast — are called "typhoons." They are the same weather phenomenon.
-
Hurricane Hilary threatens ‘catastrophic and life-threatening’ flooding in Mexico and California
Canva
74 vs. 155
- Minimum wind speed for a Category 1 vs. Category 5 hurricane
1–5
- Categories of hurricanes — based on wind speed — on the Saffir-Simpson Scale
79
- Minimum temperature (in Fahrenheit) of water required for a hurricane to form
100–300
- Number of miles that a hurricane can cover
20–40
- Width of a typical hurricane eye, in miles
150
- Number of hurricanes — aka "typhoons" and "tropical cyclones" — that can form around the world each year
20
- Number of names issued by the World Meteorological Organization to give tropical storms at the start of every hurricane season
Collateral Damage
20
- Number of feet above sea level that water rises over land in a typical storm surge
9 in 10
- Number of hurricane-related deaths caused by storm surges
127
- Highest number of tornadoes spawned by a single tropical cyclone, Hurricane Ivan (2004) — across 9 states
~$1 Trillion
- Combined total damage inflicted by the 10 costliest hurricanes in U.S. history
~2.6 Trillion
- Combined total cost of 360 billion-dollar weather and climate disasters since 1980, as of July 11, 2023
2020
- Most active Atlantic hurricane season to date — by number of named storms, 30, including 14 hurricanes
2005
- Most active Atlantic hurricane season to date — by number of hurricanes, 15
31
- Number of days of longest cyclone to touch the U.S., Hurricane/Typhoon John in 1994
37
- Number of days of longest tropical cyclone in global history, Cyclone Freddy in 2023
87.01
- Highest Accumulated Cyclone Energy (ACE) — measuring cyclone strength — recorded for a single tropical cyclone worldwide, Cyclone Freddy in 2023
- Hurricane Katrina (2005): $193.8 Billion
- Hurricane Harvey (2017): $153.8 Billion
- Hurricane Ian (2022): $115.2 Billion
- Hurricane Maria (2017): $110.7 Billion
- Hurricane Sandy (2012): $85.2 Billion
- Great Galveston Hurricane (1900): 8,000 Deaths
- Hurricane Maria (2017): 2,975 Deaths
- San Felipe-Okeechobee Hurricane (1928): 2,500 Deaths
- Hurricane Katrina (2005): 1,207 Deaths
- Cheniere Caminada Hurricane (1893): 1,100
Behind the Ranking
First, Gutter Gnome determined the factors (metrics) that are most relevant to rank the Most Hurricane-Vulnerable Counties. A weight was assigned to each factor based on its importance and the factors were grouped into three categories: Risk, Hurricane History, and Financial Impact. The categories, factors, and their weights are listed in the table below.
For each of 318 U.S. counties with a Hurricane Risk Score determined by the National Center for Disaster Preparedness (NCDP), Gutter Gnome then gathered data on each factor from the Federal Emergency Management Agency (FEMA), National Center for Disaster Preparedness (NCDP), and National Oceanic and Atmospheric Administration (NOAA).
Finally, scores were calculated (out of 100 points) for each county to determine its rank in each factor, each category, and overall. A county's Overall Score is the average of its scores across all factors and categories. The highest Overall Score ranked "Most Vulnerable" (No. 1) and the lowest "Least Vulnerable" (No. 318).
Notes
- The "Least Vulnerable" among individual factors may not be No. 318 due to ties.
- Although some hurricanes did not directly cross over a particular county, hurricanes within 100 miles (the average coverage area of a typical hurricane) of the county's center were counted in its history, as it still may have been impacted by those storms. The study therefore included all hurricanes that made landfall within 100 miles of each county's center.
- NCDP's dataset does not currently include Hurricane Risk data for the Eastern Pacific Basin. West Coast counties therefore were excluded from the sample, as well.
This story was produced by Gutter Gnome and reviewed and distributed by Stacker Media.
