NEW YORK — At a gas station outside New York City, retired probation officer Karen Stowe was faced with a pump price she didn’t want to pay. She bought groceries from the convenience store instead, planning to buy cheaper gas elsewhere.
“The price is so high, people have to think very hard about where they’re driving to,” said Stowe, who had just been volunteering at a food pantry. “People are in trouble, and that’s the truth.”
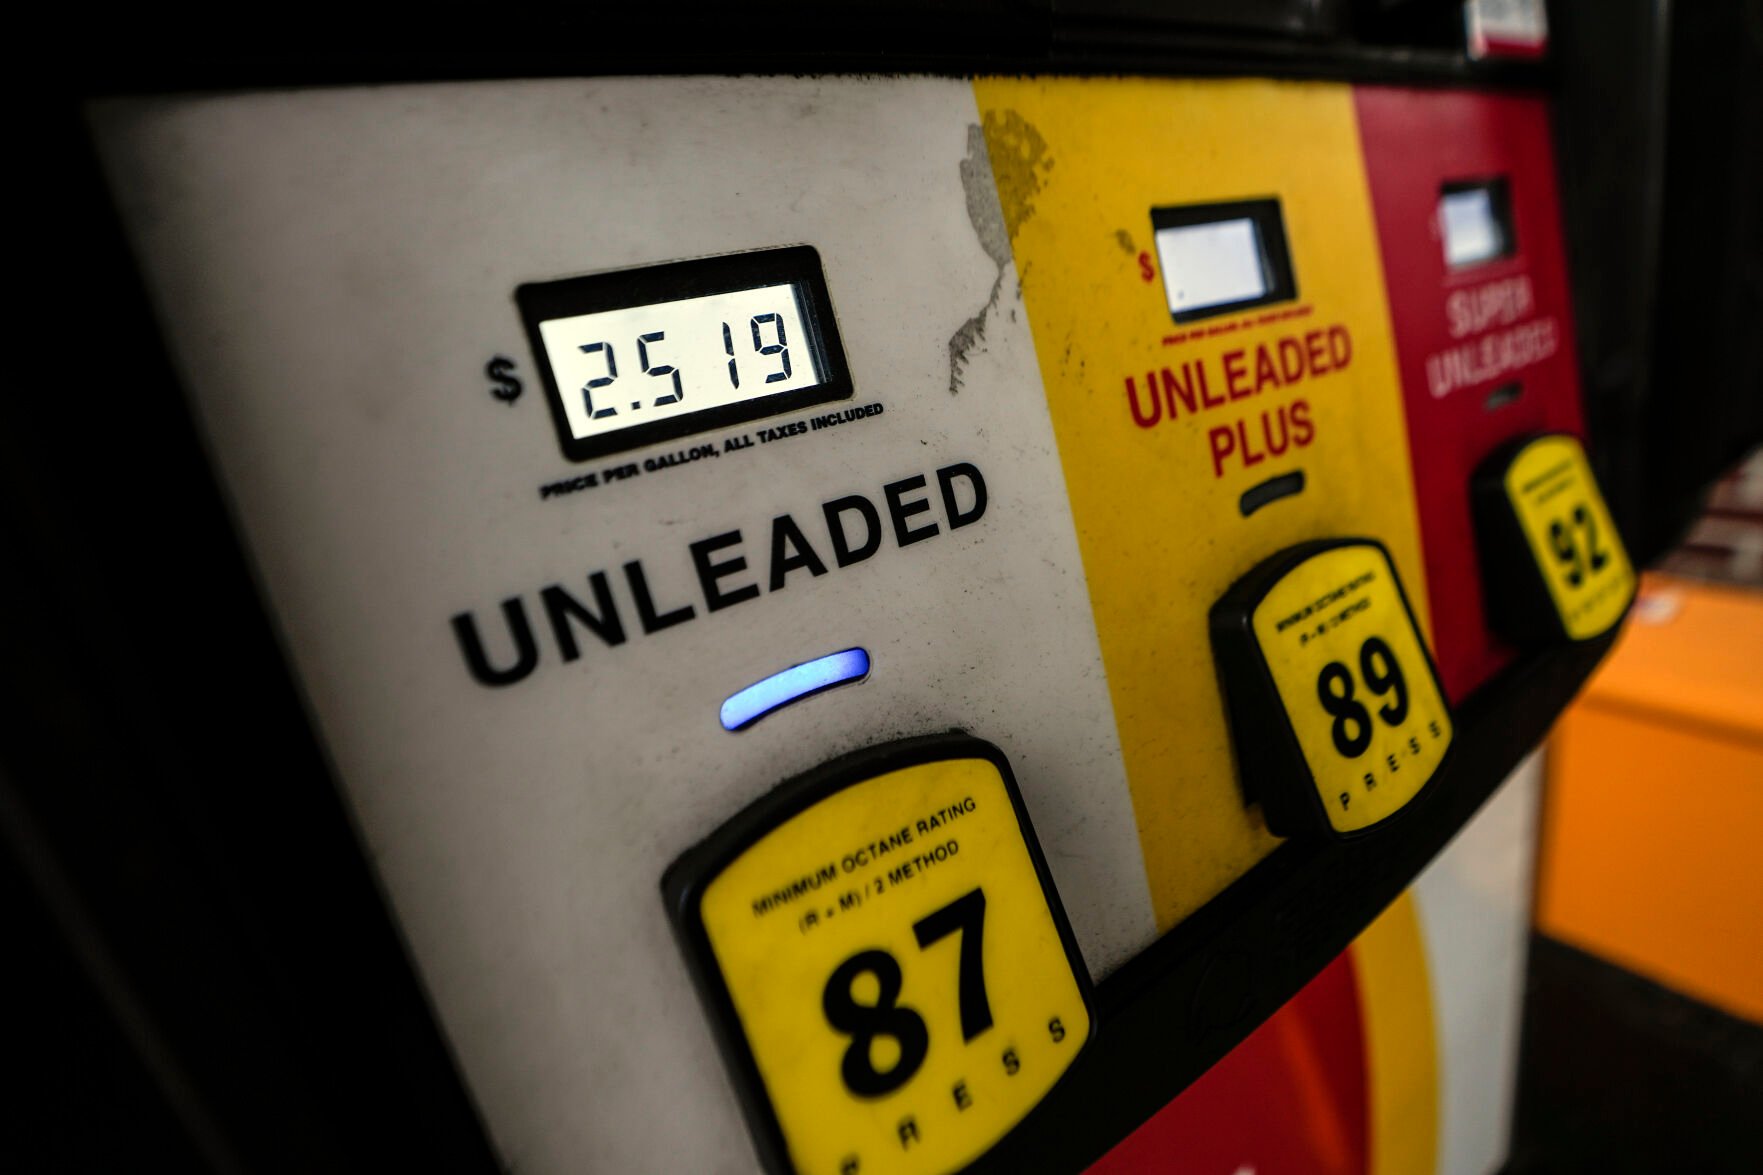
John Bazemore, Associated Press
Gas pumps are shown Monday in Madison, Ga. Drivers in the U.S. and Europe are getting a break from the record-high pump prices they endured over the summer. But that price tag is still difficult for many customers.
Though drivers in the U.S., Europe and elsewhere are getting a break from the sky-high gasoline prices they endured over the summer, the cost is still difficult for many who have been struggling with relentless inflation. The U.S. average was $3.19 per gallon, down from a record $5 in June, while European Union pump prices have dropped the equivalent of 55 cents, to $6.41 per gallon, since October.
Drivers now hope the situation doesn’t get worse after a series of cutbacks tied to Russia’s war in Ukraine, accidents and the slowing global economy have strained the world’s oil supply. While oil and gasoline prices have dropped despite a recent supply crunch, those threats could end up pushing costs higher this winter.
What’s the world facing?
- A new EU ban on imports of most Russian oil.
- At the same time, the Group of Seven leading democracies and 27-nation EU capped the price of Russian crude for other countries at $60 per barrel.
- There was a major leak along the Keystone pipeline in the U.S., which halted oil shipments along a major corridor.
- Dozens of oil tankers were stuck in Turkey for days.
- The OPEC+ coalition of oil producers has cut back production.
“The global system can withstand probably a few more days of these outages, but if they persist, they’re going to play a major role in price hikes,” said Claudio Galimberti, senior vice president of analysis at Rystad Energy.
A key reason restrictions on oil supply have not sent prices higher: Traders think there will be less demand for oil in the future, due to fears that the global economy is headed into recession, which would mean less driving and manufacturing. And some investors worry China’s looser COVID-19 restrictions could backfire for the nation’s economy.
“It can quickly turn into a major COVID wave which engulfs the hospitals and then is going to have a worse effect on demand than COVID policy,” Galimberti said.
The restrictions on Russian exports are likely to have a bigger impact on oil prices next month. Although Western nations have banned Russian oil, customers in India and China are buying it, so there’s enough oil on the market for those who need it. More than 97% of Russia’s seaborne crude exports went to China and India last month, according to Refinitiv, a financial market data provider.
“We do not ask our companies to buy Russian oil. We ask them to buy oil,” Indian External Affairs Minister Subrahmanyam Jaishankar said in Parliament recently. “But it is a sensible policy to go where we get the best deal in the interest of Indian people, and that’s exactly what we are trying to do.”
In February, global oil supply could get more limited, because European nations won’t be able to buy Russian refined products such as gasoline and diesel, so Russia could cut back on producing oil.
“So far, there hasn’t been a major decline in Russian production. But once Russia cannot export products to Europe, they will need to decrease production, and that will result in a supply shortage, which will be reflected in the prices most likely,” Galimberti said.
Russia also could decide not to produce oil due to the G-7 price cap. Its oil is selling for less than that now. But if the price goes up and approaches the cap, Russia could decide to take oil off the market, analysts said.
“There’s another shoe to drop on that front,” said Kevin Book, managing director at Clearview Energy Partners.
The price cap will lock in a discount on Russian oil, especially in light of the $100 per barrel Russia earned just a few months ago, White House press secretary Karine Jean-Pierre said.
“We are focused on limiting Putin’s ability to profit from rising prices to fund his illegal war, while promoting stable global energy markets,” Jean-Pierre said. “This is not about Russian oil off the market. This is about the cap — the cap at this level maintains clear incentives for Russia to continue exporting, and we believe that it should.”
International standard Brent crude oil was selling for about $80 a barrel Friday. That’s likely to grow to $92 per barrel on average next year, according to projections by the U.S. Energy Information Administration. That is still below $125 seen this summer.
When it comes to prices at the pump, they’re lower than they were last year, but Americans have paid $2 to $3 per gallon for most of the last decade, according to AAA data.
In the EU, where taxes account for a larger share of the cost of gasoline, prices fell to 1.65 euros per liter ($6.41 per gallon) as of Dec. 12 from 1.80 euros per liter ($6.96 per gallon) at the end of October, according to figures from the bloc’s executive Commission.
The recent price drop coupled with freezing weather has kept Aria Razdar, 28, behind the wheel of his BMW hatchback in Frankfurt, Germany. During the summer price spike, he would ride a Vespa scooter to work and school, but gasoline prices fell and so did the temperature.
“Right now, prices are a little more reasonable — actually they’re still high, but in comparison,” Razdar, a child care worker studying to be a teacher, said as he finished pumping fuel in an icy wind.
He spent a bit under 30 euros ($32) to fill up for the week, a cost he said he could manage for the convenience of driving 12 minutes to work instead of spending 45 minutes on public transit.
-
Drivers stuck in limbo as world’s oil supply reshuffles
fizkes
Photo Credit: fizkes / Shutterstock
Rising prices have been top of mind for most U.S. households since early 2021. Despite efforts by the Federal Reserve to tamp down inflation, year-over-year price increases remain stubbornly high. According to the most recent data from the Bureau of Labor Statistics, prices are 7.8% higher than a year ago, which is below June’s 40-year record of 9.0%, but still well above the target rate of 2%. One of the biggest drivers of price increases has been skyrocketing energy costs, which Americans have been feeling both at the gas pump and through higher utility bills.
-
Drivers stuck in limbo as world’s oil supply reshuffles
Energy prices have experienced some of the sharpest increases of any spending category. In June, when inflation hit a four-decade high, energy prices increased by a whopping 41.5% from the year prior. While energy price increases have moderated since then, they were still up nearly 18% in October. A surge in natural gas prices can explain much of the increase. Global demand for natural gas remains high, while the supply—much of which comes from Russia—has been cut.
Energy prices have experienced some of the sharpest increases of any spending category. In June, when inflation hit a four-decade high, energy prices increased by a whopping 41.5% from the year prior. While energy price increases have moderated since then, they were still up nearly 18% in October. A surge in natural gas prices can explain much of the increase. Global demand for natural gas remains high, while the supply—much of which comes from Russia—has been cut.
-
-
Drivers stuck in limbo as world’s oil supply reshuffles
According to the U.S. Census Bureau, the typical American household spends $245 per month on utilities, or 3.5% of their household income. At over 60%, electricity accounts for the largest share of monthly utility costs. Rising electricity prices have been largely driven by increased wholesale power prices due to higher natural gas prices. Half of American homes use natural gas—the next biggest spending category—for heating or cooling, and high natural gas prices are projected this coming winter as demand remains high.
According to the U.S. Census Bureau, the typical American household spends $245 per month on utilities, or 3.5% of their household income. At over 60%, electricity accounts for the largest share of monthly utility costs. Rising electricity prices have been largely driven by increased wholesale power prices due to higher natural gas prices. Half of American homes use natural gas—the next biggest spending category—for heating or cooling, and high natural gas prices are projected this coming winter as demand remains high.
-
Drivers stuck in limbo as world’s oil supply reshuffles
While the typical American household spends around $245 per month on utilities, utility spending varies significantly due to factors such as climate, energy prices, and household size. States in the Northeast spend the most overall, as a result of both cold winters and hot summers, but residents in the South spend the most relative to household income. At 4.9% and 4.8%, respectively, West Virginia and Mississippi households allocate the greatest share of income towards utilities. At the opposite end of the spectrum, a typical household in Maryland, Hawaii, Colorado, or Utah spends just 2.7% of their income on utilities.
To determine the U.S. metropolitan areas with the highest utility bills, researchers on behalf of Self Financial analyzed the latest data from the U.S. Census Bureau. The researchers ranked metros according to median utilities spending as a share of household income. Researchers also calculated median monthly spending on electric, gas, sewer and water, and other fuels.
Here are the U.S. metropolitan areas with the highest utility bills.
-
-
Drivers stuck in limbo as world’s oil supply reshuffles
-
Drivers stuck in limbo as world’s oil supply reshuffles
Shutterstock
Photo Credit: f11photo / Shutterstock
- Utilities spending as a share of household income: 3.4%
- Median monthly utilities spending: $294
- Median monthly electric spending: $150
- Median monthly gas spending: $100
- Median monthly sewer and water spending: $42
- Median monthly spending on other fuels: $100
-
-
Drivers stuck in limbo as world’s oil supply reshuffles
Shutterstock
Photo Credit: John S. Quinn / Shutterstock
- Utilities spending as a share of household income: 3.5%
- Median monthly utilities spending: $273
- Median monthly electric spending: $150
- Median monthly gas spending: $70
- Median monthly sewer and water spending: $63
- Median monthly spending on other fuels: $42
-
Drivers stuck in limbo as world’s oil supply reshuffles
Shutterstock
Photo Credit: Sean Pavone / Shutterstock
- Utilities spending as a share of household income: 3.6%
- Median monthly utilities spending: $233
- Median monthly electric spending: $100
- Median monthly gas spending: $80
- Median monthly sewer and water spending: $50
- Median monthly spending on other fuels: $46
-
-
Drivers stuck in limbo as world’s oil supply reshuffles
Shutterstock
Photo Credit: Sean Pavone / Shutterstock
- Utilities spending as a share of household income: 3.6%
- Median monthly utilities spending: $250
- Median monthly electric spending: $140
- Median monthly gas spending: $80
- Median monthly sewer and water spending: $42
- Median monthly spending on other fuels: $40
-
Drivers stuck in limbo as world’s oil supply reshuffles
Shutterstock
Photo Credit: Tupungato / Shutterstock
- Utilities spending as a share of household income: 3.6%
- Median monthly utilities spending: $272
- Median monthly electric spending: $150
- Median monthly gas spending: $60
- Median monthly sewer and water spending: $50
- Median monthly spending on other fuels: $29
-
-
Drivers stuck in limbo as world’s oil supply reshuffles
Shutterstock
Photo Credit: Sean Pavone / Shutterstock
- Utilities spending as a share of household income: 3.7%
- Median monthly utilities spending: $293
- Median monthly electric spending: $140
- Median monthly gas spending: $100
- Median monthly sewer and water spending: $50
- Median monthly spending on other fuels: $100
-
Drivers stuck in limbo as world’s oil supply reshuffles
Shutterstock
Photo Credit: Sean Pavone / Shutterstock
- Utilities spending as a share of household income: 3.8%
- Median monthly utilities spending: $235
- Median monthly electric spending: $150
- Median monthly gas spending: $50
- Median monthly sewer and water spending: $46
- Median monthly spending on other fuels: $17
-
-
Drivers stuck in limbo as world’s oil supply reshuffles
Shutterstock
Photo Credit: Sean Pavone / Shutterstock
- Utilities spending as a share of household income: 3.8%
- Median monthly utilities spending: $236
- Median monthly electric spending: $130
- Median monthly gas spending: $60
- Median monthly sewer and water spending: $48
- Median monthly spending on other fuels: $25
-
Drivers stuck in limbo as world’s oil supply reshuffles
Shutterstock
Photo Credit: Ivan Cholakov / Shutterstock
- Utilities spending as a share of household income: 3.8%
- Median monthly utilities spending: $265
- Median monthly electric spending: $140
- Median monthly gas spending: $80
- Median monthly sewer and water spending: $55
- Median monthly spending on other fuels: $42
-
-
Drivers stuck in limbo as world’s oil supply reshuffles
Shutterstock
Photo Credit: Jacob Boomsma / Shutterstock
- Utilities spending as a share of household income: 3.9%
- Median monthly utilities spending: $235
- Median monthly electric spending: $140
- Median monthly gas spending: $40
- Median monthly sewer and water spending: $51
- Median monthly spending on other fuels: $21
-
Drivers stuck in limbo as world’s oil supply reshuffles
Shutterstock
Photo Credit: AevanStock / Shutterstock
- Utilities spending as a share of household income: 3.9%
- Median monthly utilities spending: $263
- Median monthly electric spending: $110
- Median monthly gas spending: $90
- Median monthly sewer and water spending: $60
- Median monthly spending on other fuels: $67
-
-
Drivers stuck in limbo as world’s oil supply reshuffles
Shutterstock
Photo Credit: Jacob_Boomsma / Shutterstock
- Utilities spending as a share of household income: 4.0%
- Median monthly utilities spending: $280
- Median monthly electric spending: $180
- Median monthly gas spending: $50
- Median monthly sewer and water spending: $77
- Median monthly spending on other fuels: $33
-
Drivers stuck in limbo as world’s oil supply reshuffles
Shutterstock
Photo Credit: Sean Pavone / Shutterstock
- Utilities spending as a share of household income: 4.1%
- Median monthly utilities spending: $267
- Median monthly electric spending: $160
- Median monthly gas spending: $80
- Median monthly sewer and water spending: $60
- Median monthly spending on other fuels: $21
-
-
Drivers stuck in limbo as world’s oil supply reshuffles
Shutterstock
Photo Credit: Sean Pavone / Shutterstock
- Utilities spending as a share of household income: 4.2%
- Median monthly utilities spending: $261
- Median monthly electric spending: $200
- Median monthly gas spending: $60
- Median monthly sewer and water spending: $21
- Median monthly spending on other fuels: $17
-
Drivers stuck in limbo as world’s oil supply reshuffles
Shutterstock
Photo Credit: Sean Pavone / Shutterstock
- Utilities spending as a share of household income: 4.5%
- Median monthly utilities spending: $284
- Median monthly electric spending: $180
- Median monthly gas spending: $60
- Median monthly sewer and water spending: $40
- Median monthly spending on other fuels: $25
