The housing market in 2021 was one for the record books. With prices at historic highs and the number of listings in a deep hole, open houses looked like Black Friday sales and many would-be buyers were elbowed out of the melee.
In 2021, the share of buyers paying all cash for home purchases trended higher in the United States, but the overwhelming majority of home sales still involved mortgages. Unfortunately, as with every year, many 2021 mortgage applications were met with denials.
The following analysis of the 7.1 million mortgage applications filed that year uncovers several markers of the unusual homebuying market: a steep rise in loan amounts, an increase in the number of mortgage denials directly tied to high-priced homes, and some changes in loan types that reflect stiff competition.
Higher home prices = bigger loans
Mortgages for single-family homes averaged $343,000 in 2021. That’s a 15% increase from the 2020 average. The jump is particularly notable when you consider these mortgages rose just 8% from 2019 to 2020, a one-year increase that includes the beginning of home prices’ precipitous climb.
Demand for homes has been high for the past few years, and this competition and high prices mean that some potential buyers can’t be successful. As the size of the average mortgage balloons by 15%, for instance, people already stretching their homebuying budget can’t keep up.
Thankfully, in 2022, the number of listed homes has begun to increase in many markets. Price growth has slowed and fewer home sales are ending with a bidding war. But now buyers must contend with higher mortgage rates — a single percentage point change from 5% to 6% on a $343,000 mortgage, for instance, means $215 more each month on a house payment and a difference of roughly $77,500 in interest over the life of the loan.

Getty Images
moving, people, repair and real estate concept - happy african american couple with carpet at new home
Approved, denied: Have outcomes changed?
In 2021, lenders processed some 7.1 million mortgage applications, up 8% or about a half million from the year before. Among those, 73% resulted in loan originations and 7% resulted in denials. The remainder were closed for incompleteness or approved but not originated.
Over the past few years, the rates of denials and originations haven’t changed much. In 2020, for example, 8% of applications were denied and 73% resulted in loan originations. In 2019, those shares were virtually identical.
But, the reasons for these denials have changed slightly.
Change in 2021 denial reasons reflects high-priced market
How much debt a person carries relative to how much money they bring home, or their debt-to-income ratio, plays a significant role in their chances of mortgage approval. And DTI ratio was (once again) the most commonly cited reason for denials in 2021, accounting for 31% of refused loans.
However, lenders were denying more loans because of overpriced homes.
Collateral refers to the actual value of the home being purchased relative to the amount being borrowed. When an appraisal comes in low, the bank would be taking a much bigger risk by issuing the loan — in a worst-case scenario, the collateral it held (the house) wouldn’t be enough to cover what’s owed.
Insufficient collateral accounted for 16% of mortgage denials in 2021, after just 13% in 2020. It tied with credit history for the second-most common primary reason for denials. Three percentage points may not seem significant, but that change accounts for 14,300 more denials, while the number denied for credit history fell by nearly 22,000.

Advice for buyers: Buyers faced with denials for debt-to-income ratio or credit history have their marching orders: When lending standards are high, entering the market with less debt and a robust credit history increases your chances for approval. A denial based on collateral isn’t quite as straightforward, but there are options.
If possible, paying the difference between the appraisal and the amount you offered is the simplest. By increasing your down payment, you decrease how much you have to borrow, closing the gap between the appraisal and loan amount. You can also ask for a review of the appraisal if you think it’s wrong, or renegotiate the price with the seller. Finally, if you’ve written an appraisal contingency in your offer to purchase, you can walk away — a tough thing to do when you’ve actually gone under contract in this competitive market.
Loan types signal steep competition
While the number of new mortgages rose by 9% overall in 2021, that bump conceals some interesting changes across loan types.
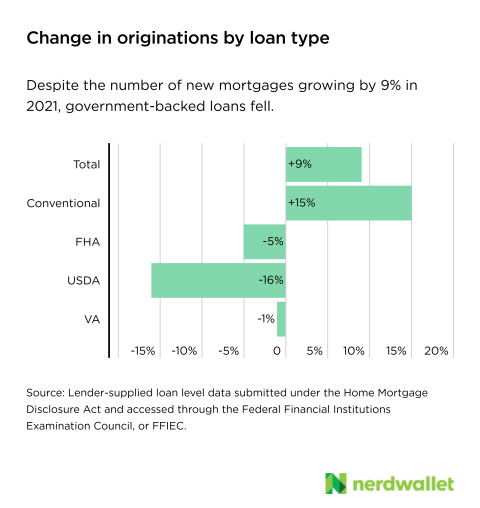
Conventional mortgages typically have the strictest standards for approval, while government-backed loans like FHA and USDA loans are generally available to people with lower credit scores and down payments. These programs make homeownership attainable for borrowers who may otherwise be wedged out.
Unfortunately, these loans can look less competitive to home sellers — they may take longer to fund, have a reputation for tougher appraisal standards, and may be seen as more at risk of falling apart before the closing date.
With multiple offers on their kitchen tables, sellers are likely to opt for the biggest offers and easiest transactions. Cash is king, of course, but if the offer involves a mortgage, conventional loans typically move to the top of the stack.
This is just one additional way the 2021 housing market pushed out would-be buyers on the edge of qualifying for a home purchase.
Advice for buyers: In the current market, buying a home with a USDA or FHA loan isn’t impossible, just more difficult. It will take finding the right seller and the right home, but you can make your offer more competitive by easing the transaction: Come with a preapproval, ask for repairs after the inspection only if they reach a certain dollar amount threshold and work with a real estate agent who’s familiar with the local market and different loan types.
-
How high-priced homes changed the mortgage game in 2021
Shutterstock
Photo Credit: Artazum / Shutterstock
The real estate market since the start of the COVID-19 pandemic has been tough on all buyers, but aspiring first-time buyers may have struggled most of all.
For much of 2020 and 2021, the housing market faced a challenging combination of high demand and low supply. Young people were already growing into the largest segment of buyers as the Millennial generation came of age. When the COVID-19 pandemic hit, preferences for more living space, increased remote work opportunities, and other factors related to the pandemic encouraged even more people to enter the market. But existing owners proved reluctant to part with their homes, with supply on the market reaching a record low late in 2020. As a result, competition in the market drove the median home price up by 36% over the last two years. The run-up in home values was good news for people who already had equity in their homes, but it pushed prices out of reach for first-time buyers.
More recently, persistent inflation—and policymakers’ responses to it—have also made it harder to save up for a home. The prices of household essentials like groceries, energy, and especially rent have grown quickly over the last 18 months, leaving first-time buyers with less money to set aside. And now, as the U.S. Federal Reserve raises interest rates in efforts to combat inflation, the costs to take out a mortgage loan have risen dramatically. The average 30-year mortgage interest rate in the U.S. is more than double what it was at the start of 2022, translating into hundreds more dollars per month in payments for would-be buyers.
-
How high-priced homes changed the mortgage game in 2021
While recent trends in the market have been especially challenging, buyers have struggled with affordability for longer than that. One issue is that the rate of growth in home values has outpaced that of household incomes over the last 20 years after adjusting for inflation. From 2020 to 2021, median home values increased by 37.8%, while the median household income grew by just 8.78% over the same span.
While recent trends in the market have been especially challenging, buyers have struggled with affordability for longer than that. One issue is that the rate of growth in home values has outpaced that of household incomes over the last 20 years after adjusting for inflation. From 2020 to 2021, median home values increased by 37.8%, while the median household income grew by just 8.78% over the same span.
-
-
How high-priced homes changed the mortgage game in 2021
Supply has been another constraint for first-time homebuyers. The U.S. faces a shortage of housing overall, but builders are also building fewer of the smaller, more affordable homes they used to. Single-family one- or two-bedroom homes represented 24.1% of newly built homes in the mid-1980s, but just 6.2% today. Over the same span, the share of 4+ bedroom homes among new builds grew from 19.3% to 49.6%.
Supply has been another constraint for first-time homebuyers. The U.S. faces a shortage of housing overall, but builders are also building fewer of the smaller, more affordable homes they used to. Single-family one- or two-bedroom homes represented 24.1% of newly built homes in the mid-1980s, but just 6.2% today. Over the same span, the share of 4+ bedroom homes among new builds grew from 19.3% to 49.6%.
-
How high-priced homes changed the mortgage game in 2021
While conditions are challenging overall for new buyers, some parts of the U.S. are more favorable. Ideal markets for new buyers display a combination of adequate supply, a high share of smaller homes in the housing supply, relatively low sales prices for starter homes, and strong homeownership rates among young people. By these measures, West Virginia is the best state in the country to find a starter home, followed by Oklahoma and Mississippi. At the local level, Southern and Rust Belt cities lead the way.
The data used in this analysis is from the U.S. Census Bureau, Zillow, and Redfin. To determine the locations where you’re most likely to find a starter home, researchers at Construction Coverage calculated a composite score based on the percentage of homes with three or fewer bedrooms, the median sale price of homes with three or fewer bedrooms, the months of supply of houses for sale, and the homeownership rate for householders under 35 years old. In the event of a tie, the location with the greater percentage of homes with three or fewer bedrooms was ranked higher.
Here are the U.S. metropolitan areas where you’re most likely to find a starter home.
-
-
How high-priced homes changed the mortgage game in 2021
-
How high-priced homes changed the mortgage game in 2021
Shutterstock
Photo Credit: Sean Pavone / Shutterstock
- Composite score: 44.7
- Percentage of homes with ≤ 3 bedrooms: 66.6%
- Median sale price of homes with ≤ 3 bedrooms: $189,103
- Months supply: 1.5
- Homeownership rate for under-35 householders: 10.1%
Shutterstock
Photo Credit: Sean Pavone / Shutterstock
- Composite score: 44.7
- Percentage of homes with ≤ 3 bedrooms: 66.6%
- Median sale price of homes with ≤ 3 bedrooms: $189,103
- Months supply: 1.5
- Homeownership rate for under-35 householders: 10.1%
-
-
How high-priced homes changed the mortgage game in 2021
Shutterstock
Photo Credit: Rudy Balasko / Shutterstock
- Composite score: 45.6
- Percentage of homes with ≤ 3 bedrooms: 65.6%
- Median sale price of homes with ≤ 3 bedrooms: $224,694
- Months supply: 1.8
- Homeownership rate for under-35 householders: 13.3%
Shutterstock
Photo Credit: Rudy Balasko / Shutterstock
- Composite score: 45.6
- Percentage of homes with ≤ 3 bedrooms: 65.6%
- Median sale price of homes with ≤ 3 bedrooms: $224,694
- Months supply: 1.8
- Homeownership rate for under-35 householders: 13.3%
-
How high-priced homes changed the mortgage game in 2021
Shutterstock
Photo Credit: Open.Tours LLC / Shutterstock
- Composite score: 45.6
- Percentage of homes with ≤ 3 bedrooms: 70.4%
- Median sale price of homes with ≤ 3 bedrooms: $226,560
- Months supply: 1.3
- Homeownership rate for under-35 householders: 10.7%
Shutterstock
Photo Credit: Open.Tours LLC / Shutterstock
- Composite score: 45.6
- Percentage of homes with ≤ 3 bedrooms: 70.4%
- Median sale price of homes with ≤ 3 bedrooms: $226,560
- Months supply: 1.3
- Homeownership rate for under-35 householders: 10.7%
-
-
How high-priced homes changed the mortgage game in 2021
Shutterstock
Photo Credit: picsbyst / Shutterstock
- Composite score: 46.3
- Percentage of homes with ≤ 3 bedrooms: 69.0%
- Median sale price of homes with ≤ 3 bedrooms: $217,655
- Months supply: 1.3
- Homeownership rate for under-35 householders: 11.6%
Shutterstock
Photo Credit: picsbyst / Shutterstock
- Composite score: 46.3
- Percentage of homes with ≤ 3 bedrooms: 69.0%
- Median sale price of homes with ≤ 3 bedrooms: $217,655
- Months supply: 1.3
- Homeownership rate for under-35 householders: 11.6%
-
How high-priced homes changed the mortgage game in 2021
Shutterstock
Photo Credit: Felix Mizioznikov / Shutterstock
- Composite score: 46.5
- Percentage of homes with ≤ 3 bedrooms: 66.3%
- Median sale price of homes with ≤ 3 bedrooms: $270,458
- Months supply: 2.7
- Homeownership rate for under-35 householders: 10.6%
Shutterstock
Photo Credit: Felix Mizioznikov / Shutterstock
- Composite score: 46.5
- Percentage of homes with ≤ 3 bedrooms: 66.3%
- Median sale price of homes with ≤ 3 bedrooms: $270,458
- Months supply: 2.7
- Homeownership rate for under-35 householders: 10.6%
-
-
How high-priced homes changed the mortgage game in 2021
Shutterstock
Photo Credit: Kevin J King / Shutterstock
- Composite score: 47.0
- Percentage of homes with ≤ 3 bedrooms: 73.4%
- Median sale price of homes with ≤ 3 bedrooms: $343,531
- Months supply: 2.0
- Homeownership rate for under-35 householders: 9.2%
Shutterstock
Photo Credit: Kevin J King / Shutterstock
- Composite score: 47.0
- Percentage of homes with ≤ 3 bedrooms: 73.4%
- Median sale price of homes with ≤ 3 bedrooms: $343,531
- Months supply: 2.0
- Homeownership rate for under-35 householders: 9.2%
-
How high-priced homes changed the mortgage game in 2021
Shutterstock
Photo Credit: Paul Brady Photography / Shutterstock
- Composite score: 47.8
- Percentage of homes with ≤ 3 bedrooms: 70.7%
- Median sale price of homes with ≤ 3 bedrooms: $251,963
- Months supply: 1.8
- Homeownership rate for under-35 householders: 10.7%
Shutterstock
Photo Credit: Paul Brady Photography / Shutterstock
- Composite score: 47.8
- Percentage of homes with ≤ 3 bedrooms: 70.7%
- Median sale price of homes with ≤ 3 bedrooms: $251,963
- Months supply: 1.8
- Homeownership rate for under-35 householders: 10.7%
-
-
How high-priced homes changed the mortgage game in 2021
Shutterstock
Photo Credit: Harold Stiver / Shutterstock
- Composite score: 48.3
- Percentage of homes with ≤ 3 bedrooms: 69.5%
- Median sale price of homes with ≤ 3 bedrooms: $225,713
- Months supply: 1.4
- Homeownership rate for under-35 householders: 12.5%
Shutterstock
Photo Credit: Harold Stiver / Shutterstock
- Composite score: 48.3
- Percentage of homes with ≤ 3 bedrooms: 69.5%
- Median sale price of homes with ≤ 3 bedrooms: $225,713
- Months supply: 1.4
- Homeownership rate for under-35 householders: 12.5%
-
How high-priced homes changed the mortgage game in 2021
Shutterstock
Photo Credit: LHBLLC / Shutterstock
- Composite score: 52.6
- Percentage of homes with ≤ 3 bedrooms: 72.0%
- Median sale price of homes with ≤ 3 bedrooms: $319,999
- Months supply: 2.7
- Homeownership rate for under-35 householders: 9.5%
Shutterstock
Photo Credit: LHBLLC / Shutterstock
- Composite score: 52.6
- Percentage of homes with ≤ 3 bedrooms: 72.0%
- Median sale price of homes with ≤ 3 bedrooms: $319,999
- Months supply: 2.7
- Homeownership rate for under-35 householders: 9.5%
-
-
How high-priced homes changed the mortgage game in 2021
Shutterstock
Photo Credit: Rob Hainer / Shutterstock
- Composite score: 54.9
- Percentage of homes with ≤ 3 bedrooms: 68.0%
- Median sale price of homes with ≤ 3 bedrooms: $192,535
- Months supply: 2.1
- Homeownership rate for under-35 householders: 11.2%
Shutterstock
Photo Credit: Rob Hainer / Shutterstock
- Composite score: 54.9
- Percentage of homes with ≤ 3 bedrooms: 68.0%
- Median sale price of homes with ≤ 3 bedrooms: $192,535
- Months supply: 2.1
- Homeownership rate for under-35 householders: 11.2%
-
How high-priced homes changed the mortgage game in 2021
Shutterstock
Photo Credit: evenfh / Shutterstock
- Composite score: 56.0
- Percentage of homes with ≤ 3 bedrooms: 69.2%
- Median sale price of homes with ≤ 3 bedrooms: $227,670
- Months supply: 2.9
- Homeownership rate for under-35 householders: 9.3%
Shutterstock
Photo Credit: evenfh / Shutterstock
- Composite score: 56.0
- Percentage of homes with ≤ 3 bedrooms: 69.2%
- Median sale price of homes with ≤ 3 bedrooms: $227,670
- Months supply: 2.9
- Homeownership rate for under-35 householders: 9.3%
-
-
How high-priced homes changed the mortgage game in 2021
Shutterstock
Photo Credit: Ivan Cholakov / Shutterstock
- Composite score: 56.2
- Percentage of homes with ≤ 3 bedrooms: 71.4%
- Median sale price of homes with ≤ 3 bedrooms: $221,702
- Months supply: 1.9
- Homeownership rate for under-35 householders: 11.4%
Shutterstock
Photo Credit: Ivan Cholakov / Shutterstock
- Composite score: 56.2
- Percentage of homes with ≤ 3 bedrooms: 71.4%
- Median sale price of homes with ≤ 3 bedrooms: $221,702
- Months supply: 1.9
- Homeownership rate for under-35 householders: 11.4%
-
How high-priced homes changed the mortgage game in 2021
Shutterstock
Photo Credit: Volodymyr TVERDOKHLIB / Shutterstock
- Composite score: 57.7
- Percentage of homes with ≤ 3 bedrooms: 76.1%
- Median sale price of homes with ≤ 3 bedrooms: $425,625
- Months supply: 3.5
- Homeownership rate for under-35 householders: 7.7%
Shutterstock
Photo Credit: Volodymyr TVERDOKHLIB / Shutterstock
- Composite score: 57.7
- Percentage of homes with ≤ 3 bedrooms: 76.1%
- Median sale price of homes with ≤ 3 bedrooms: $425,625
- Months supply: 3.5
- Homeownership rate for under-35 householders: 7.7%
-
-
How high-priced homes changed the mortgage game in 2021
Shutterstock
Photo Credit: Henryk Sadura / Shutterstock
- Composite score: 59.7
- Percentage of homes with ≤ 3 bedrooms: 71.6%
- Median sale price of homes with ≤ 3 bedrooms: $195,589
- Months supply: 1.6
- Homeownership rate for under-35 householders: 13.3%
Shutterstock
Photo Credit: Henryk Sadura / Shutterstock
- Composite score: 59.7
- Percentage of homes with ≤ 3 bedrooms: 71.6%
- Median sale price of homes with ≤ 3 bedrooms: $195,589
- Months supply: 1.6
- Homeownership rate for under-35 householders: 13.3%
-
How high-priced homes changed the mortgage game in 2021
Shutterstock
Photo Credit: AevanStock / Shutterstock
- Composite score: 68.0
- Percentage of homes with ≤ 3 bedrooms: 72.1%
- Median sale price of homes with ≤ 3 bedrooms: $190,349
- Months supply: 2.9
- Homeownership rate for under-35 householders: 10.5%
Shutterstock
Photo Credit: AevanStock / Shutterstock
- Composite score: 68.0
- Percentage of homes with ≤ 3 bedrooms: 72.1%
- Median sale price of homes with ≤ 3 bedrooms: $190,349
- Months supply: 2.9
- Homeownership rate for under-35 householders: 10.5%
