
Cities whose drivers need to buckle up
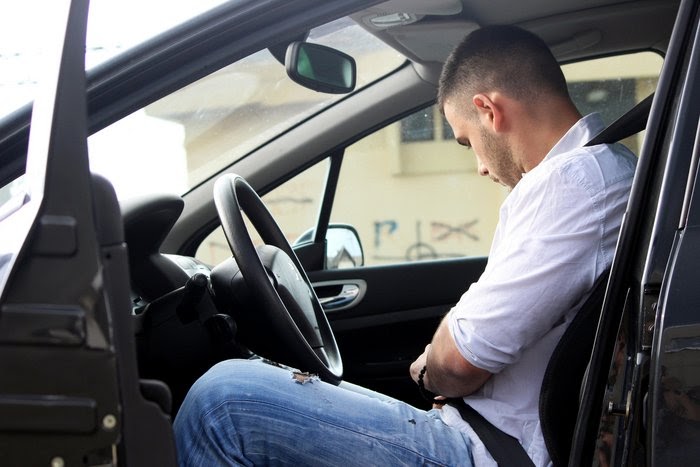 Photo Credit: Alamy Stock Photo
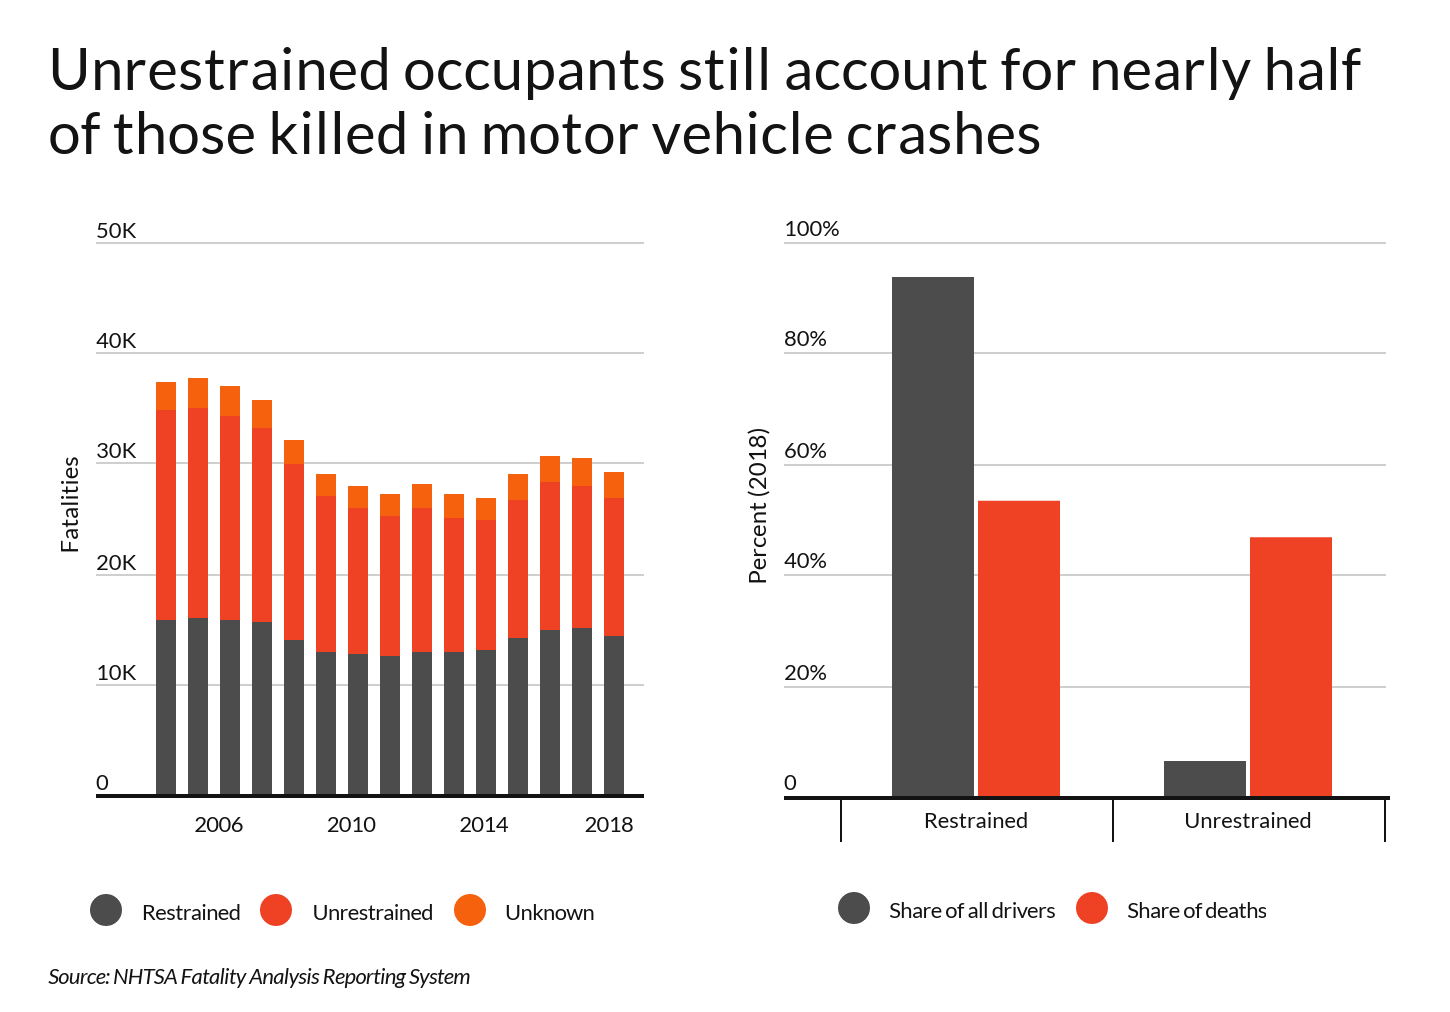
The number of motor vehicle fatalities has been trending down for decades, driven in large part by more people wearing seat belts. In 2004, more than 19,000 occupants killed in car crashes were unrestrained at the time, compared to 12,426 in 2018. While data from the Centers for Disease Control and Prevention indicates that just 6.3 percent of U.S. adults don’t wear a seat belt all (or most) of the time, unrestrained occupants still account for nearly half of individuals killed in car crashes, according to the National Highway Traffic Safety Administration.
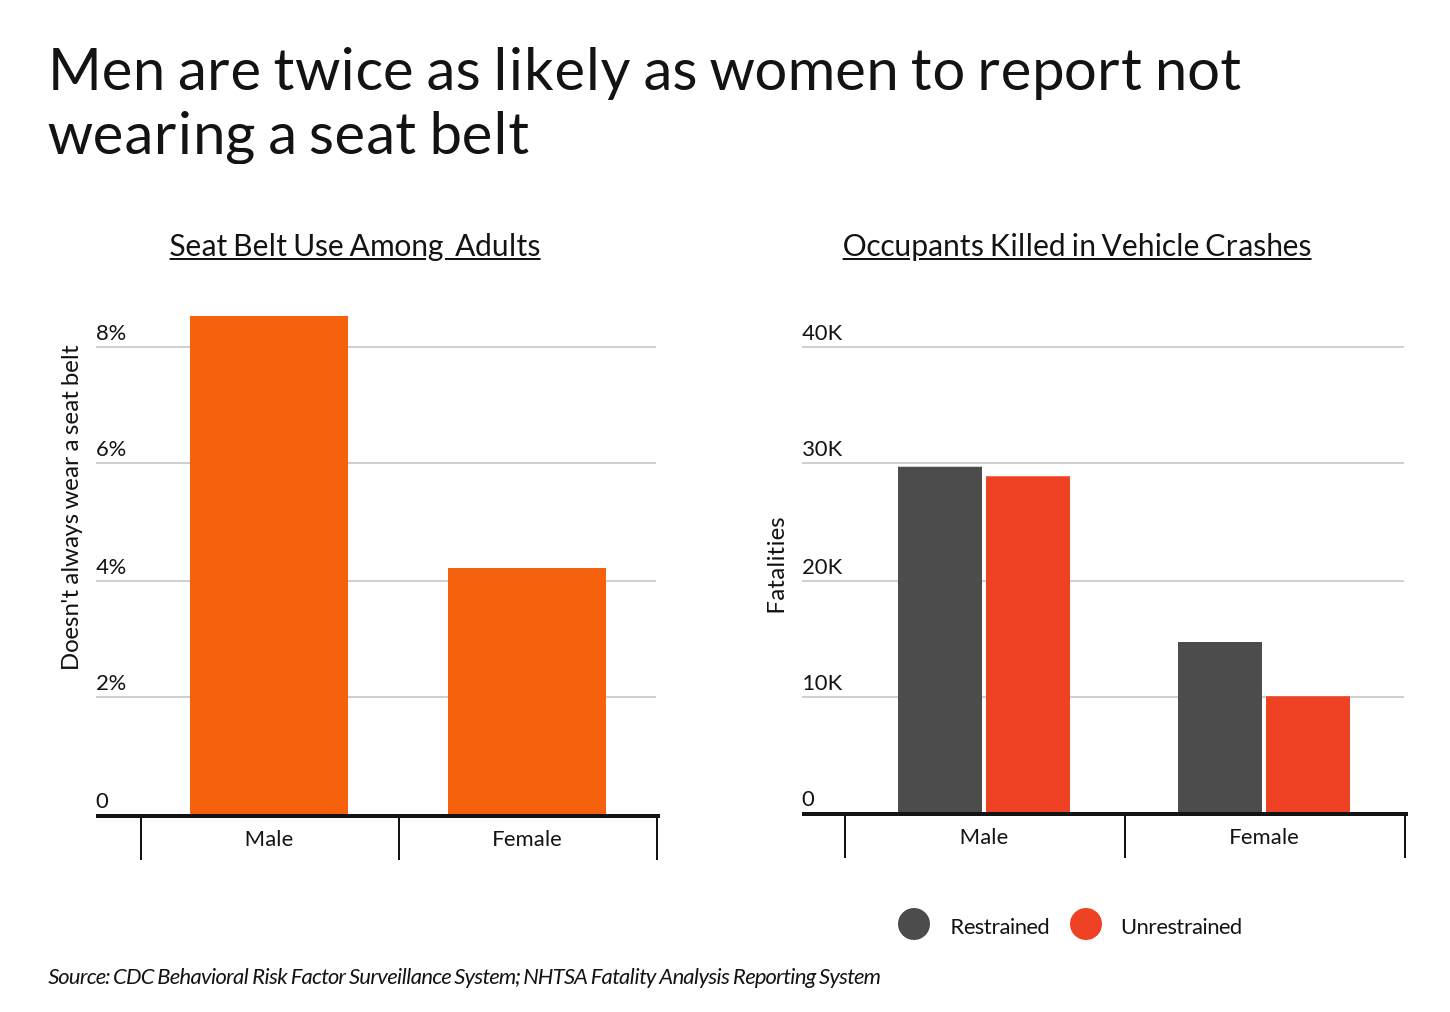
Despite improvements in restraint use overall, rates vary widely by gender. According to the CDC, men are twice as likely as women to report not wearing a seat belt (8.5 percent compared to 4.2 percent). Men are also about 2.5 times as likely as women to die in car crashes, based on traffic fatality data collected by the NHTSA from 2016-2018. Among all occupants killed in car crashes, men are about three times as likely as women to have not been wearing a seat belt.
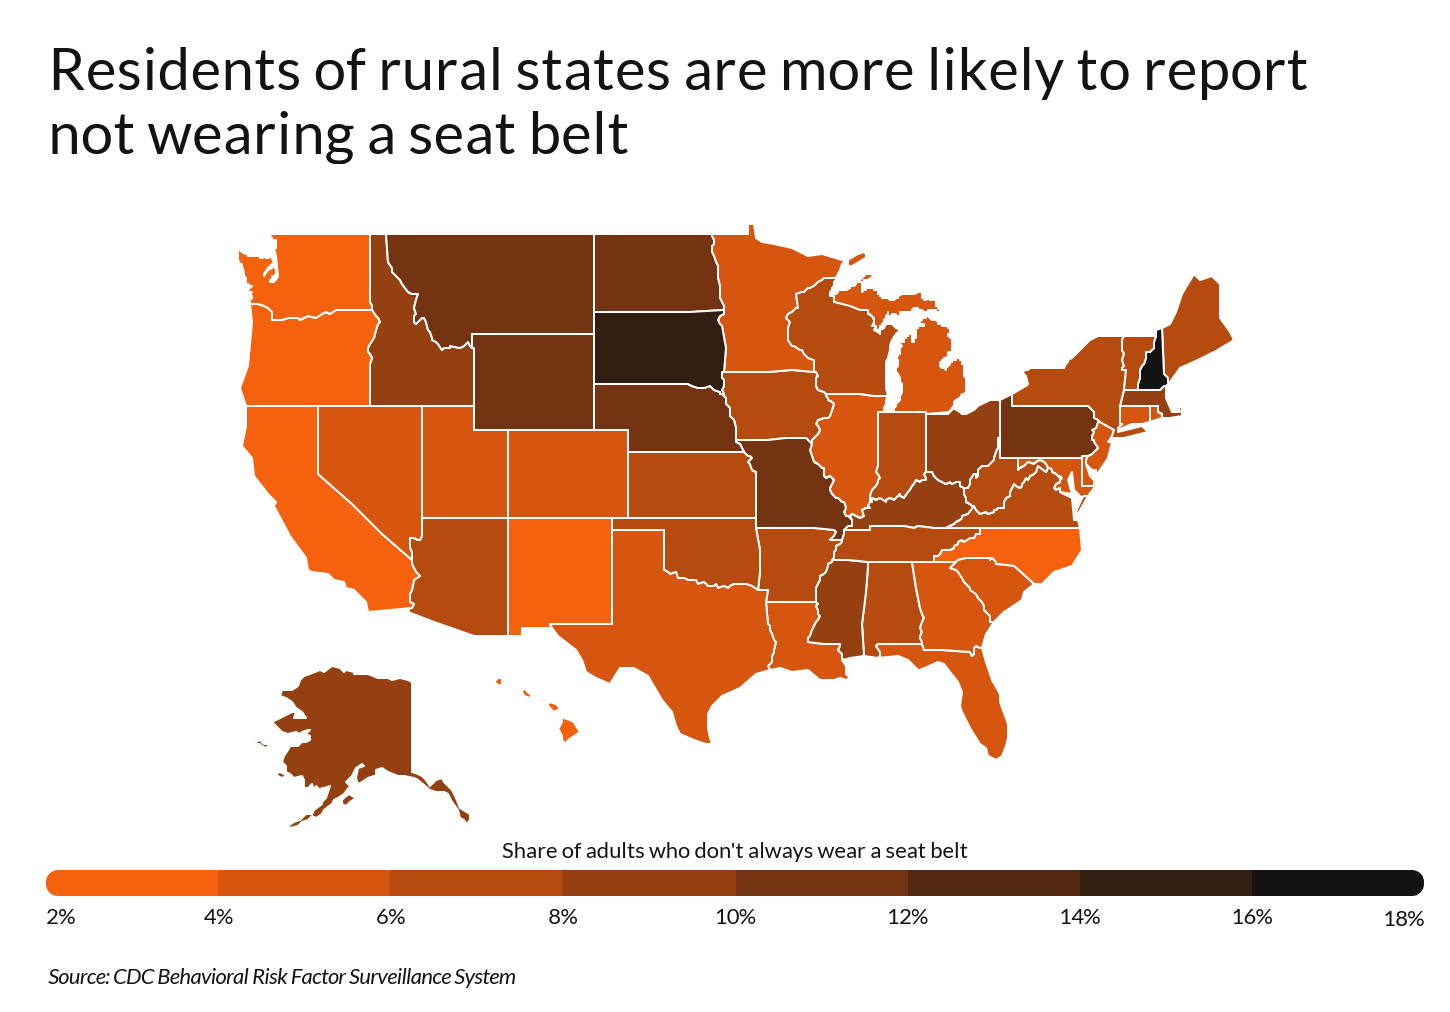
Location also plays a role in the widespread adoption of seat belts. In general, states with large rural populations are more likely to report large proportions of residents not wearing seat belts. For example, adults in New Hampshire and South Dakota—which have some of the smallest urban populations—are more than twice as likely as average to report not wearing seat belts (17.2 percent and 15.0 percent, respectively). By contrast, California, Oregon, and Washigton—where more than eight in 10 residents live in urban areas—report the highest rates of restraint use in the country.
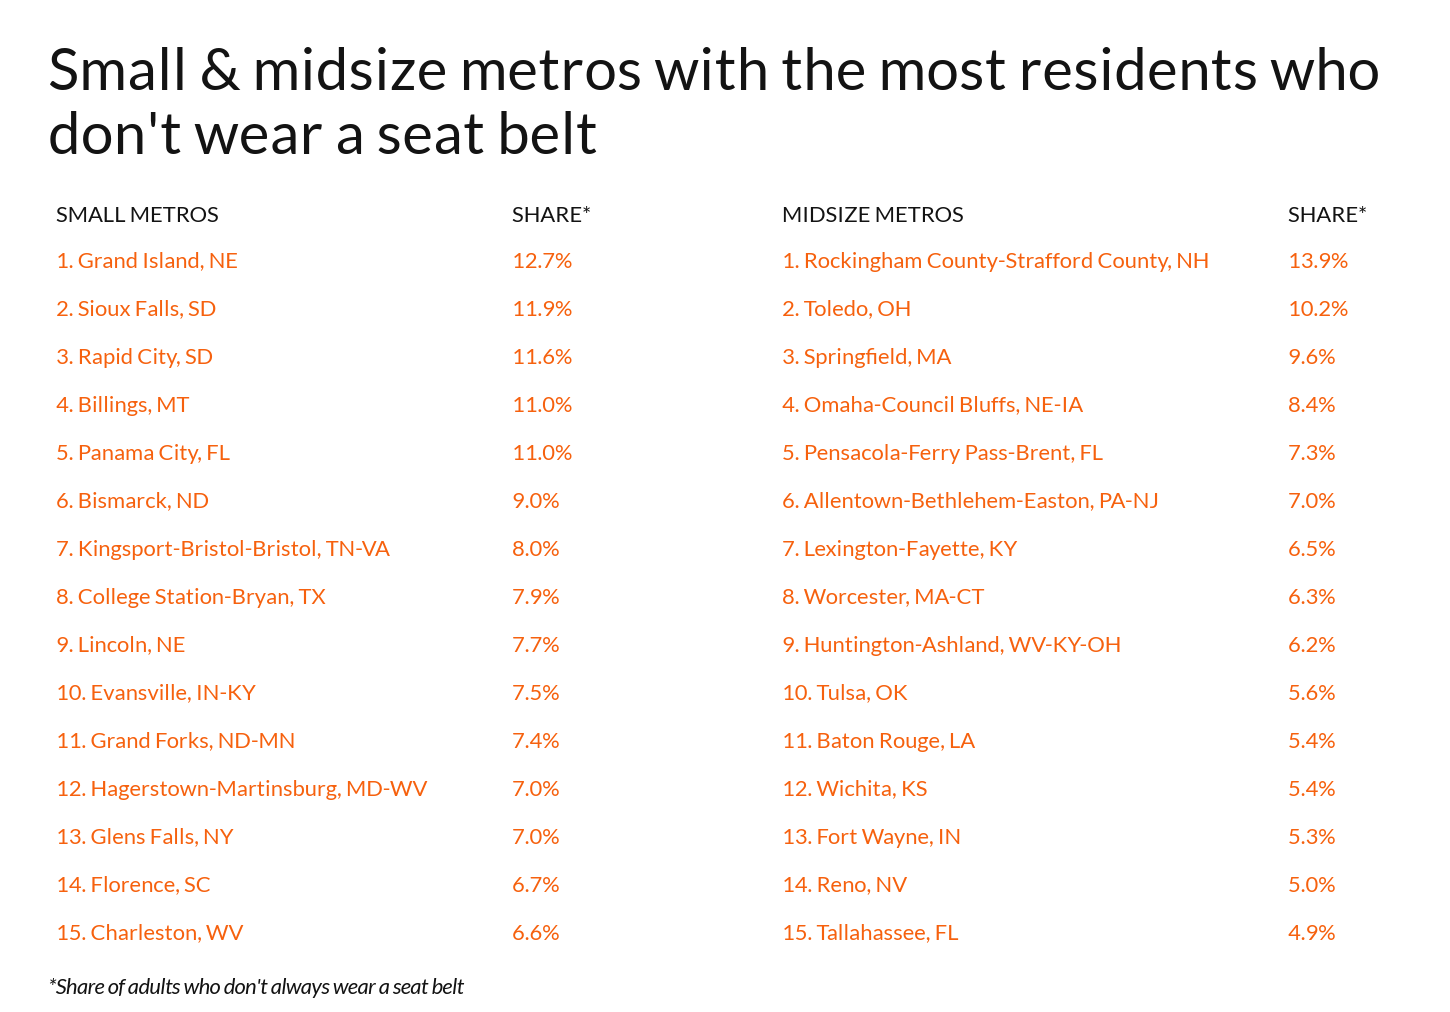
To find which metropolitan areas’ residents are least likely to wear seat belts, researchers at CoPilot, a car shopping app, analyzed restraint use statistics from the CDC’s Behavioral Risk Factor Surveillance System. They also analyzed how many unrestrained occupants were killed in car crashes in each metro area from 2016 to 2018. To improve relevance, metros were grouped into cohorts based on population size: large metros (1,000,000 residents or more), midsize metros (350,000-999,999 residents), and small metros (less than 350,000 residents).
Similar to the state-level analysis discussed above, West Coast metros are largely absent from the list of areas with poor seat belt use rates. Locations on the East Coast and in the Midwest are disproportionately represented. Here are the U.S. metropolitan areas with the most drivers that don’t buckle up.
Large Metros Whose Drivers Need to Buckle Up

Photo Credit: Alamy Stock Photo
15. Indianapolis-Carmel-Anderson, IN
- Share of adults who don’t always wear a seat belt: 6.2%
- Unrestrained occupants killed in car crashes (% of total): 43.7%
- Total unrestrained occupants killed in car crashes (2016-2018): 177
- Number of car commuters: 919,605

Photo Credit: Alamy Stock Photo
14. Richmond, VA
- Share of adults who don’t always wear a seat belt: 6.3%
- Unrestrained occupants killed in car crashes (% of total): 52.3%
- Total unrestrained occupants killed in car crashes (2016-2018): 159
- Number of car commuters: 584,601
Photo Credit: Alamy Stock Photo
13. Milwaukee-Waukesha-West Allis, WI
- Share of adults who don’t always wear a seat belt: 6.7%
- Unrestrained occupants killed in car crashes (% of total): 63.6%
- Total unrestrained occupants killed in car crashes (2016-2018): 150
- Number of car commuters: 700,998

Photo Credit: Alamy Stock Photo
12. Louisville/Jefferson County, KY-IN
- Share of adults who don’t always wear a seat belt: 6.7%
- Unrestrained occupants killed in car crashes (% of total): 57.6%
- Total unrestrained occupants killed in car crashes (2016-2018): 223
- Number of car commuters: 571,510

Photo Credit: Alamy Stock Photo
11. St. Louis, MO-IL
- Share of adults who don’t always wear a seat belt: 7.0%
- Unrestrained occupants killed in car crashes (% of total): 53.5%
- Total unrestrained occupants killed in car crashes (2016-2018): 307
- Number of car commuters: 1,257,271
Photo Credit: Alamy Stock Photo
10. Camden, NJ
- Share of adults who don’t always wear a seat belt: 7.3%
- Unrestrained occupants killed in car crashes (% of total): 35.2%
- Total unrestrained occupants killed in car crashes (2016-2018): 93
- Number of car commuters: 538,531

Photo Credit: Alamy Stock Photo
9. Columbus, OH
- Share of adults who don’t always wear a seat belt: 7.3%
- Unrestrained occupants killed in car crashes (% of total): 52.9%
- Total unrestrained occupants killed in car crashes (2016-2018): 216
- Number of car commuters: 939,254

Photo Credit: Alamy Stock Photo
8. Cincinnati, OH-KY-IN
- Share of adults who don’t always wear a seat belt: 7.5%
- Unrestrained occupants killed in car crashes (% of total): 54.2%
- Total unrestrained occupants killed in car crashes (2016-2018): 244
- Number of car commuters: 970,497

Photo Credit: Alamy Stock Photo
7. Memphis, TN-MS-AR
- Share of adults who don’t always wear a seat belt: 7.7%
- Unrestrained occupants killed in car crashes (% of total): 44.6%
- Total unrestrained occupants killed in car crashes (2016-2018): 204
- Number of car commuters: 585,573

Photo Credit: Alamy Stock Photo
6. New York-Jersey City-White Plains, NY-NJ
- Share of adults who don’t always wear a seat belt: 7.9%
- Unrestrained occupants killed in car crashes (% of total): 30.4%
- Total unrestrained occupants killed in car crashes (2016-2018): 121
- Number of car commuters: 3,183,178

Photo Credit: Alamy Stock Photo
5. Cambridge-Newton-Framingham, MA
- Share of adults who don’t always wear a seat belt: 8.9%
- Unrestrained occupants killed in car crashes (% of total): 47.8%
- Total unrestrained occupants killed in car crashes (2016-2018): 66
- Number of car commuters: 978,741
Photo Credit: Alamy Stock Photo
4. Cleveland-Elyria, OH
- Share of adults who don’t always wear a seat belt: 9.2%
- Unrestrained occupants killed in car crashes (% of total): 59.6%
- Total unrestrained occupants killed in car crashes (2016-2018): 186
- Number of car commuters: 884,299

Photo Credit: Alamy Stock Photo
3. Pittsburgh, PA
- Share of adults who don’t always wear a seat belt: 9.8%
- Unrestrained occupants killed in car crashes (% of total): 68.1%
- Total unrestrained occupants killed in car crashes (2016-2018): 294
- Number of car commuters: 971,606

Photo Credit: Alamy Stock Photo
2. Philadelphia, PA
- Share of adults who don’t always wear a seat belt: 11.6%
- Unrestrained occupants killed in car crashes (% of total): 61.7%
- Total unrestrained occupants killed in car crashes (2016-2018): 82
- Number of car commuters: 617,452

Photo Credit: Alamy Stock Photo
1. Boston, MA
- Share of adults who don’t always wear a seat belt: 11.6%
- Unrestrained occupants killed in car crashes (% of total): 56.5%
- Total unrestrained occupants killed in car crashes (2016-2018): 100
- Number of car commuters: 703,780
Detailed Findings & Methodology
Statistics on seat belt use are from the CDC’s Behavioral Risk Factor Surveillance System, a telephone survey conducted each year on adults across the United States. All of the statistics used in this study are the most recent available. For metropolitan areas, the most recent year of data available is either 2016 or 2017, depending on the location. For state- and national-level data, the survey results are from 2018.
Regarding seat belt use, survey respondents were asked: “do you always or nearly always wear a seat belt?” For this study, locations were ordered based on the proportion of adults who answered “no” to this question. Only metropolitan areas covered in CDC data were included in this analysis.
Statistics on restraint use among occupants killed in motor vehicle crashes are from the NHTSA’s Fatality Analysis Reporting System. Car commuting statistics are from the U.S. Census Bureau’s American Community Survey 1-Year Estimates.
It’s clear that seat belts have many safety benefits for both drivers and passengers. According to the NHTSA, buckling up prevents drivers and passengers from being ejected from the vehicle in the event of a crash and also reduces the chance of injury from airbags. In fact, the NHTSA states that wearing a seat belt can reduce the risk of fatal injury by 45 percent and the risk of moderate to critical injury by 50 percent.
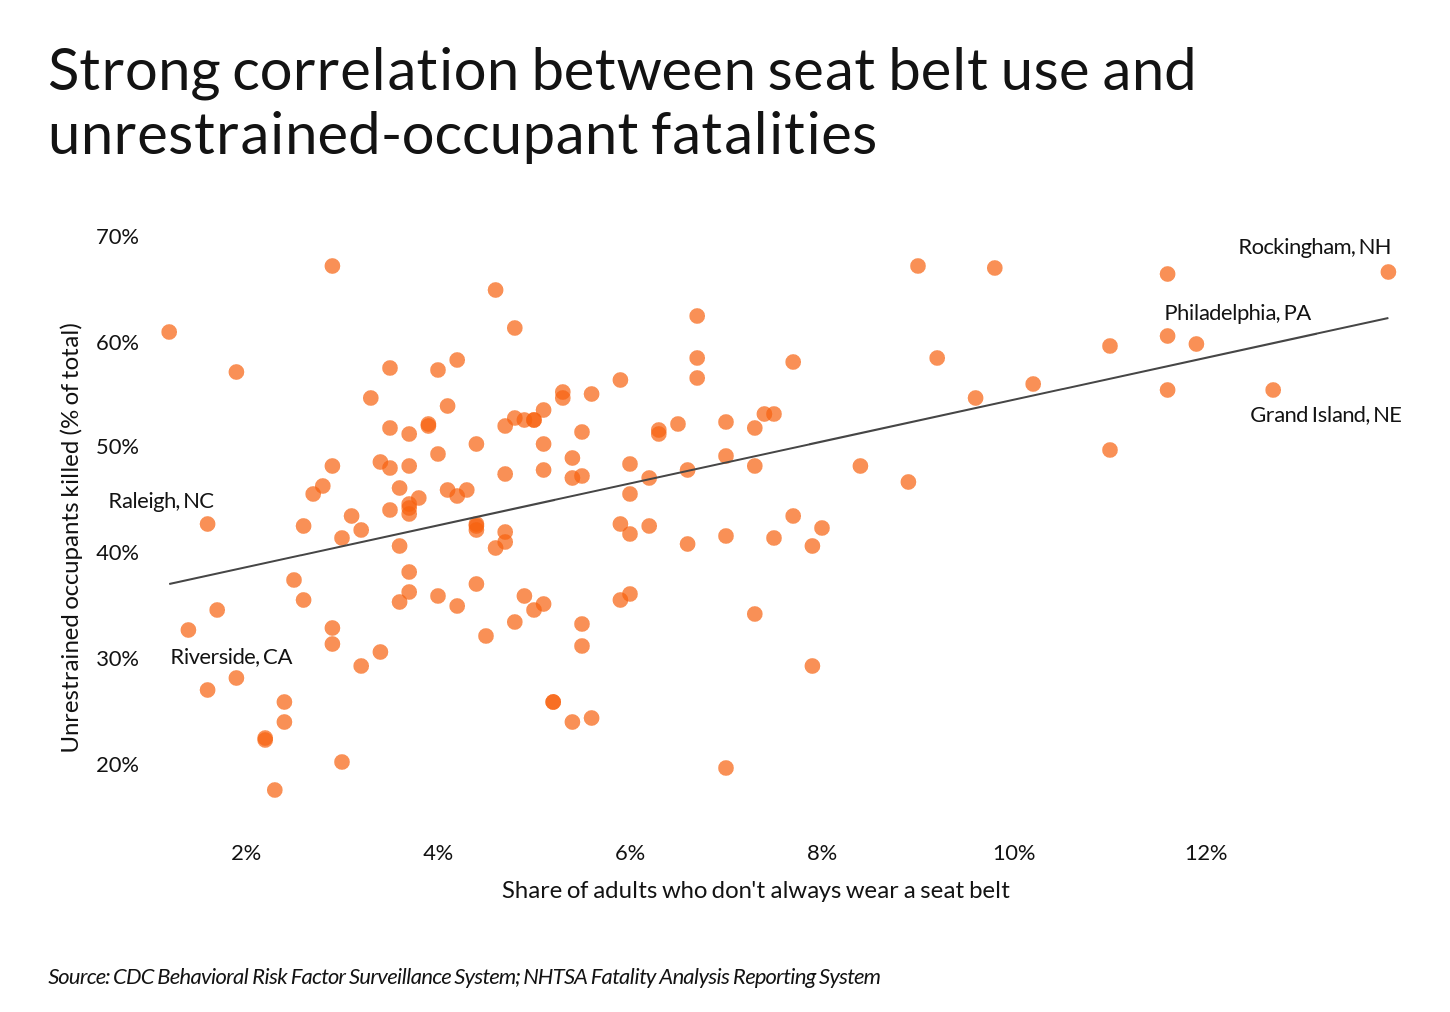
Perhaps not surprisingly, among metropolitan areas, there is a strong positive correlation between the share of adults who report not wearing a seat belt and the share of occupants killed in motor vehicle crashes that were unrestrained at the time of the crash. This data underscores the life-saving potential of buckling up while driving.
To promote safe driving behavior, the NHTSA has launched PSA campaigns such as Buckle Up America and Click It or Ticket. Educating the public about the safety benefits of seat belts, as well as the legal consequences for not wearing one, can further reinforce seat belt use in locations where significant percentages of the population still refuse to buckle up.