NEW YORK — U.S. employers are increasingly posting salary ranges for job openings, even in states where it’s not required by law, according to analysts with several major job search websites.
Following new legislation in New York City, California, Washington, Colorado and elsewhere, employers across the country are becoming more transparent about pay in order to stay competitive with companies in states that require employers to post salary ranges, experts say. A tight labor market and significant increase in remote work have also contributed to the rise.
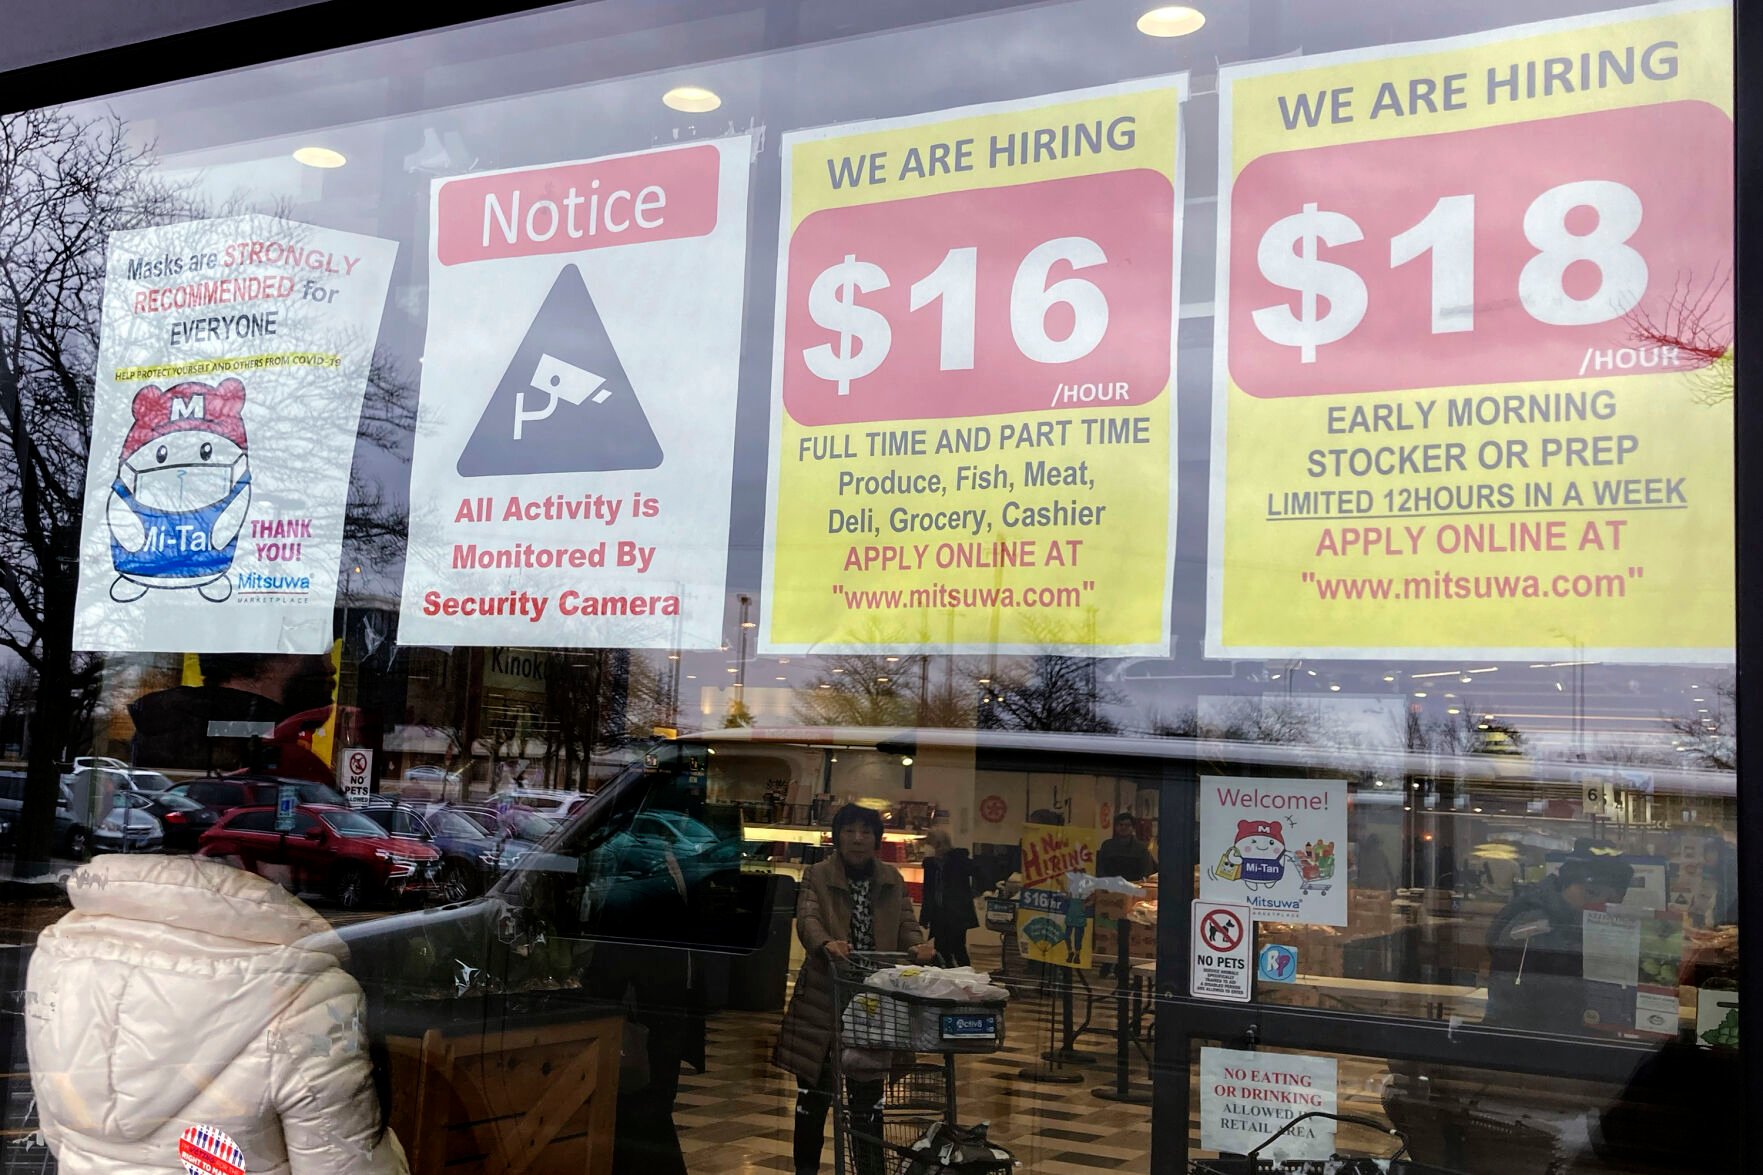
Nam Y. Huh, Associated Press
Hiring signs are displayed at a grocery store Jan. 13 in Arlington Heights, Ill. Employers are increasingly posting salary ranges for job openings, even in states where it's not mandated by law, according to analysts with employment sites Indeed, GlassDoor and Monster.
The number of U.S. job postings that include salary information more than doubled between February 2020 and February 2023, from 18.4% to 43.7%, according to a new report from job search site Indeed.
Salary visibility is lowest in the southern U.S., which accounted for 18 of the 20 least transparent metro areas, and highest in the western part of the country, which tends to have more regulation.
Advocates say it’s a trend that benefits women and people of color, who statistically fare less well in hiring negotiations.
Rather than placing the responsibility on the job-seeker or employee to determine how their pay compares to coworkers, and what fair compensation might be, the laws shift that expectation to the employer.
Kate Bahn, chief economist at the Washington Center for Equitable Growth, says that means employers have less of an upper hand in determining pay. Laws that forbid employers from asking potential hires about salary history in recent years do similar work.
-
More job seekers now know how much they’ll be paid
DenisProduction.com // Shutterstock
Americans certainly know how to spend money. And they're doing it at escalating rates—even outpacing inflation.
U.S. households spent an average of $67,000 in 2021 on everything from groceries to political contributions, according to Bureau of Labor Statistics data. That was a 9.1% increase over 2020. Pre-tax incomes were up about 3.7%, and the Consumer Price Index—which measures inflation through urban prices of various goods and services—increased by 4.7%.
Predictably, the highest expenditures among all income brackets are on necessities like housing, transportation, and food. But spending can vary widely among demographics.
CouponBirds used 2021 BLS Consumer Expenditures Survey data to analyze spending differences based on pre-tax household income, examining spending overall and within four major categories. Spending increased within all income brackets in 2021 and grew faster than pre-tax earnings in each.
Income inevitably has the most profound effect on how people spend. The idea of living paycheck to paycheck isn't new. Still, the data spells it out clearly: Lower-income households must spend a higher share on daily necessities—and don't make enough to cover even that, reinforcing cycles of poverty. Meanwhile, higher earners have more to save and invest in retirement.
Among this data set, the average household size of all survey respondents was 2.4, with the highest income bracket at 3.2 people and the lowest income bracket at 1.7 people. While this analysis focuses on spending at various income levels, household size and other factors (age, race, place, etc.) also influence spending patterns.
Continue reading to learn more about how Americans spend depending on household income.
-
More job seekers now know how much they’ll be paid
CouponBirds
Spending money is unavoidable. For the lowest-income people in the United States, that can often mean spending money they don't have.
For households earning under $15,000 per year, about 90% of their spending is on essentials: housing, groceries, utilities, transportation, health care, apparel and services, and personal care products and services. And even if that's all they spent—no eating out, no movie nights, no educational expenses—they would still be at a loss of about $20,000.
Income can include government assistance such as Social Security, unemployment, workers' compensation, public assistance, Supplemental Security Income, and the Supplementary Nutrition Assistance Program.
That makes it very difficult for lower-income households to avoid taking on debt, and many also must pay with credit as they face climbing interest rates that accumulate rapidly if they don't pay off their cards in full. Inflation over the past year has compounded the issue: Outstanding credit card balances increased by nearly 17% in November 2022 compared to the previous year, according to Federal Reserve data. Interest rates have risen from 14.6% in 2021—the year of our data analysis—to 19.07% as of preliminary November estimates, to make matters worse.
Meanwhile, high earners typically have considerable money left over after accounting for expenses. With that, they can save, invest, insure, and pay off debts, securing their financial futures against unexpected costs or dips in income.
This analysis does not necessarily tell the full financial story for many Americans, partly because it looks at pre-tax income. A few thousand dollars in tax refunds can help offset expenses for the poorest Americans, while wealthier Americans may have to pay tens of thousands of dollars in taxes each year. Still, the impact is uneven: After taxes, Americans earning less than $15,000 still have an average $20,200 deficit, while those in the highest bracket maintain four times that.
-
-
More job seekers now know how much they’ll be paid
CouponBirds
The most significant discrepancy in spending between the lowest and highest earners is in retirement savings. The wealthiest Americans have the means to allocate more than 17% of their considerably higher expenses to retirement savings.
A 2020 Retirement Research Center study found that just 18% of households had accumulated enough wealth to spend as much in retirement as they did before retirement. Three in 10 of those households continued to build wealth in the decade after retirement, though many still chose to spend less due to general uncertainty.
Without enough retirement savings, people who earn less—or don't have the means to save for retirement—may have to work later in their lives, sometimes for lower pay or in more menial jobs as skill gaps, layoffs, and market competition can force elders out of their professions.
BLS Employment Projections data shows that Americans over 55 were the only ones to increase their labor force participation rates from 2001 to 2021. The highest growth was among the oldest Americans (ages 75+). This trend is likely to continue over the next decade.
-
More job seekers now know how much they’ll be paid
CouponBirds
On average, one-third of the average American household spending goes to shelter. As the affordable housing crisis persists in many cities across the country, low-income households must spend a considerably higher share on housing, and their opportunity to buy property is dwindling.
Households earning less than $15,000 spend nearly that entire amount—$12,400 annually, or a little over $1,000 a month—on housing. Households earning over $200,000 a year spend four times as much on housing, though it comprises only 29.2% of their total spending.
One reason behind this is that most high earners own their homes, while renting is more common among lower earners, according to research from Pew. Rent is more susceptible to market increases, and mortgage payments remain consistent while homeownership creates further wealth. Some wealthy Americans can also buy homes without taking on debt, potentially reducing their housing expenses in future years.
-
-
More job seekers now know how much they’ll be paid
CouponBirds
Interestingly, Americans spend similar amounts on dining out, regardless of income bracket. It could be because restaurants serve a wide variety of food, from $2 burgers to $50 steaks. Plus, Americans value speed and convenience, including with their meals: Fast food, delivery, and take-out restaurants are an American staple, and are the most popular categories among food establishments, according to BLS data.
Despite similarities in dining out, low earners have to put a much higher share of their money toward groceries. In turn, inflation has an outsized impact on these households. The BLS reported grocery costs increased 10.4% in December 2022 compared to the previous year, and staples like eggs, flour, pasta, and coffee saw the steepest increases. Comparatively, the cost of dining out increased by about 8.3%.
-
More job seekers now know how much they’ll be paid
CouponBirds
After dipping 8.5% in 2020 amid COVID-19, BLS reported that transportation expenditures grew 11.6% in 2021. Households on the highest and lowest ends of the socioeconomic scale spend a similar share on transportation. However, there's a lot of variation among the middle-income levels.
Much of this has to do with car ownership and financing. Extremely low-income households have at most one car. More than a third of households earning under $15,000 a year don't have a car, which is significantly lower than any other bracket. By walking, biking, or using public transportation—which often offers discounted rates for low-income riders—many people don't have to spend as much getting from place to place.
For middle-income Americans, car ownership adds up. Those with incomes of $30,000 to $100,000 typically have closer to two cars. In 2021, they spent between $3,000 and $5,000 on cars and trucks, $2,000 or so on gas, and another $3,000 to $4,000 on other expenses like insurance and repairs, BLS data shows.
Those making over $150,000 typically have closer to three cars on average, but have more money to buy them outright or better credit to lock in competitive interest rates if they need financing, according to Federal Reserve data
This story originally appeared on CouponBirds and was produced and distributed in partnership with Stacker Studio.
-
-
Migrating professionals grow black middle class in South and West
Travellaggio // Getty Images
America's recovery from the COVID-19 pandemic has been complicated by inflation and climbing interest rates. Emergency federal aid helped ordinary citizens, businesses, and government agencies alike make it through the economic slowdown.
But as that dries up, a darker picture is emerging. The poverty rate climbed in 2021, while income inequality grew from 2020 to 2021. And workers actually earned less, and watched the buying power of what they did earn drop.
Stacker looked at the economies of the states and Washington D.C, with statistics from the Census Bureau's most recent 1-Year American Community Survey, released in September 2022, to rank them according to 2021 median household income. The review also includes statistics on median earnings, unemployment rate, health insurance coverage, and poverty level.
Note: The data point on median earnings is broken down to highlight the discrepancies between women and men. However, the Census collects data with a binary understanding of sex and gender, not considering other gender identities and potentially conflating sex and gender.
You may also like: Marijuana violations are taking truck drivers off the road, adding more supply chain disruptions
-
Migrating professionals grow black middle class in South and West
Canva
- Median household income: $48,716 (30.1% less than U.S. median income)
- Households earning less than $10,000: 105,133 (9.30%)
- Households earning over $200,000: 40,061 (3.50%)
- Median earnings for workers: $32,242 (men: $47,546; women: $37,056)
- Unemployment rate: 6.40%
- Families with income below poverty level: 14.40%
- Households with health insurance: 88.10%
-
-
Migrating professionals grow black middle class in South and West
Sean Pavone // Getty Images
- Median household income: $51,248 (26.5% less than U.S. median income)
- Households earning less than $10,000: 60,933 (8.40%)
- Households earning over $200,000: 31,442 (4.40%)
- Median earnings for workers: $33,739 (men: $51,981; women: $39,897)
- Unemployment rate: 6.20%
- Families with income below poverty level: 12.30%
- Households with health insurance: 93.90%
-
Migrating professionals grow black middle class in South and West
Pierre Jean Durieu // Getty Images
- Median household income: $52,087 (25.3% less than U.S. median income)
- Households earning less than $10,000: 164,981 (9.20%)
- Households earning over $200,000: 101,388 (5.70%)
- Median earnings for workers: $34,896 (men: $55,078; women: $40,136)
- Unemployment rate: 7.60%
- Families with income below poverty level: 15.20%
- Households with health insurance: 92.40%
-
-
Migrating professionals grow black middle class in South and West
Eduardo Medrano // Getty Images
- Median household income: $52,528 (24.7% less than U.S. median income)
- Households earning less than $10,000: 89,818 (7.60%)
- Households earning over $200,000: 55,972 (4.70%)
- Median earnings for workers: $33,869 (men: $47,329; women: $39,526)
- Unemployment rate: 5.50%
- Families with income below poverty level: 11.60%
- Households with health insurance: 90.80%
-
Migrating professionals grow black middle class in South and West
Kevin Ruck // Getty Images
- Median household income: $53,913 (22.7% less than U.S. median income)
- Households earning less than $10,000: 152,450 (7.70%)
- Households earning over $200,000: 101,831 (5.20%)
- Median earnings for workers: $34,925 (men: $52,177; women: $39,338)
- Unemployment rate: 5.30%
- Families with income below poverty level: 11.70%
- Households with health insurance: 90.10%
You may also like: 50 car companies that no longer exist
-
-
Migrating professionals grow black middle class in South and West
gmeland // Getty Images
- Median household income: $53,992 (22.6% less than U.S. median income)
- Households earning less than $10,000: 75,083 (9.00%)
- Households earning over $200,000: 48,458 (5.80%)
- Median earnings for workers: $34,133 (men: $51,149; women: $43,227)
- Unemployment rate: 7.80%
- Families with income below poverty level: 14.30%
- Households with health insurance: 90.00%
-
Migrating professionals grow black middle class in South and West
Alexey Stiop // Getty Images
- Median household income: $55,573 (20.3% less than U.S. median income)
- Households earning less than $10,000: 144,592 (8.10%)
- Households earning over $200,000: 92,250 (5.20%)
- Median earnings for workers: $34,928 (men: $51,842; women: $40,991)
- Unemployment rate: 5.40%
- Families with income below poverty level: 12.20%
- Households with health insurance: 94.30%
-
-
Migrating professionals grow black middle class in South and West
Paul Brady Photography // Getty Images
- Median household income: $55,826 (19.9% less than U.S. median income)
- Households earning less than $10,000: 105,917 (6.80%)
- Households earning over $200,000: 77,228 (5.00%)
- Median earnings for workers: $34,460 (men: $51,289; women: $39,781)
- Unemployment rate: 5.90%
- Families with income below poverty level: 11.50%
- Households with health insurance: 86.20%
-
Migrating professionals grow black middle class in South and West
Sean Pavone // Getty Images
- Median household income: $59,318 (14.9% less than U.S. median income)
- Households earning less than $10,000: 144,668 (7.10%)
- Households earning over $200,000: 122,320 (6.00%)
- Median earnings for workers: $35,987 (men: $52,296; women: $40,739)
- Unemployment rate: 5.60%
- Families with income below poverty level: 10.80%
- Households with health insurance: 90.00%
-
-
Migrating professionals grow black middle class in South and West
Kevin Ruck // Getty Images
- Median household income: $59,695 (14.4% less than U.S. median income)
- Households earning less than $10,000: 181,576 (6.60%)
- Households earning over $200,000: 175,898 (6.30%)
- Median earnings for workers: $36,663 (men: $51,538; women: $41,863)
- Unemployment rate: 5.30%
- Families with income below poverty level: 9.70%
- Households with health insurance: 90.00%
You may also like: States with the largest unionized workforces
-
Migrating professionals grow black middle class in South and West
Sean Pavone // Getty Images
- Median household income: $61,847 (11.3% less than U.S. median income)
- Households earning less than $10,000: 146,475 (5.90%)
- Households earning over $200,000: 157,589 (6.40%)
- Median earnings for workers: $37,083 (men: $54,140; women: $43,065)
- Unemployment rate: 4.60%
- Families with income below poverty level: 8.40%
- Households with health insurance: 90.60%
-
-
Migrating professionals grow black middle class in South and West
Canva
- Median household income: $61,972 (11.1% less than U.S. median income)
- Households earning less than $10,000: 265,655 (6.40%)
- Households earning over $200,000: 308,936 (7.40%)
- Median earnings for workers: $37,218 (men: $52,421; women: $44,297)
- Unemployment rate: 5.80%
- Families with income below poverty level: 9.40%
- Households with health insurance: 89.60%
-
Migrating professionals grow black middle class in South and West
Sean Pavone // Getty Images
- Median household income: $62,262 (10.7% less than U.S. median income)
- Households earning less than $10,000: 317,928 (6.60%)
- Households earning over $200,000: 312,314 (6.50%)
- Median earnings for workers: $38,214 (men: $57,177; women: $46,068)
- Unemployment rate: 5.40%
- Families with income below poverty level: 9.40%
- Households with health insurance: 93.50%
-
-
Migrating professionals grow black middle class in South and West
Sean Pavone // Getty Images
- Median household income: $62,743 (10.0% less than U.S. median income)
- Households earning less than $10,000: 151,979 (5.70%)
- Households earning over $200,000: 152,761 (5.70%)
- Median earnings for workers: $37,998 (men: $55,191; women: $43,215)
- Unemployment rate: 4.70%
- Families with income below poverty level: 8.30%
- Households with health insurance: 92.50%
-
Migrating professionals grow black middle class in South and West
Noah Densmore // Getty Images
- Median household income: $63,062 (9.5% less than U.S. median income)
- Households earning less than $10,000: 542,819 (6.30%)
- Households earning over $200,000: 663,997 (7.80%)
- Median earnings for workers: $35,997 (men: $51,151; women: $42,228)
- Unemployment rate: 5.60%
- Families with income below poverty level: 9.40%
- Households with health insurance: 87.90%
You may also like: The industries where workers are quitting their jobs in droves
-
-
Migrating professionals grow black middle class in South and West
Jacob Boomsma // Getty Images
- Median household income: $63,249 (9.3% less than U.S. median income)
- Households earning less than $10,000: 23,195 (5.20%)
- Households earning over $200,000: 30,784 (6.90%)
- Median earnings for workers: $35,272 (men: $55,496; women: $41,725)
- Unemployment rate: 4.00%
- Families with income below poverty level: 7.20%
- Households with health insurance: 91.80%
-
Migrating professionals grow black middle class in South and West
Hanson L // Getty Images
- Median household income: $63,498 (8.9% less than U.S. median income)
- Households earning less than $10,000: 256,830 (6.30%)
- Households earning over $200,000: 273,320 (6.70%)
- Median earnings for workers: $37,258 (men: $60,293; women: $46,914)
- Unemployment rate: 6.90%
- Families with income below poverty level: 9.00%
- Households with health insurance: 95.00%
-
-
Migrating professionals grow black middle class in South and West
Jacob Boomsma // Getty Images
- Median household income: $64,124 (8.0% less than U.S. median income)
- Households earning less than $10,000: 65,819 (5.70%)
- Households earning over $200,000: 74,933 (6.50%)
- Median earnings for workers: $38,071 (men: $54,902; women: $44,368)
- Unemployment rate: 4.40%
- Families with income below poverty level: 8.00%
- Households with health insurance: 90.80%
-
Migrating professionals grow black middle class in South and West
Sean Pavone // Getty Images
- Median household income: $64,767 (7.1% less than U.S. median income)
- Households earning less than $10,000: 32,174 (5.40%)
- Households earning over $200,000: 39,832 (6.70%)
- Median earnings for workers: $39,725 (men: $57,009; women: $47,018)
- Unemployment rate: 4.90%
- Families with income below poverty level: 7.20%
- Households with health insurance: 94.30%
-
-
Migrating professionals grow black middle class in South and West
haveseen // Getty Images
- Median household income: $65,204 (6.5% less than U.S. median income)
- Households earning less than $10,000: 14,659 (6.00%)
- Households earning over $200,000: 14,179 (5.80%)
- Median earnings for workers: $35,613 (men: $59,853; women: $40,976)
- Unemployment rate: 3.70%
- Families with income below poverty level: 7.80%
- Households with health insurance: 87.80%
You may also like: Richest women in America
-
Migrating professionals grow black middle class in South and West
f11photo // Getty Images
- Median household income: $65,600 (5.9% less than U.S. median income)
- Households earning less than $10,000: 64,244 (4.90%)
- Households earning over $200,000: 81,020 (6.20%)
- Median earnings for workers: $39,068 (men: $56,427; women: $44,801)
- Unemployment rate: 3.60%
- Families with income below poverty level: 6.90%
- Households with health insurance: 95.20%
-
-
Migrating professionals grow black middle class in South and West
Mendenhall Olga // Getty Images
- Median household income: $66,143 (5.1% less than U.S. median income)
- Households earning less than $10,000: 17,158 (4.80%)
- Households earning over $200,000: 20,292 (5.70%)
- Median earnings for workers: $37,149 (men: $52,405; women: $41,792)
- Unemployment rate: 2.80%
- Families with income below poverty level: 7.90%
- Households with health insurance: 90.50%
-
Migrating professionals grow black middle class in South and West
Sean Pavone // Getty Images
- Median household income: $66,274 (4.9% less than U.S. median income)
- Households earning less than $10,000: 85,960 (7.20%)
- Households earning over $200,000: 89,881 (7.50%)
- Median earnings for workers: $37,052 (men: $52,398; women: $44,906)
- Unemployment rate: 9.70%
- Families with income below poverty level: 10.60%
- Households with health insurance: 88.40%
-
-
Migrating professionals grow black middle class in South and West
Charles Knowles // Getty Images
- Median household income: $66,474 (4.7% less than U.S. median income)
- Households earning less than $10,000: 30,955 (4.50%)
- Households earning over $200,000: 45,347 (6.50%)
- Median earnings for workers: $34,941 (men: $51,941; women: $40,803)
- Unemployment rate: 3.30%
- Families with income below poverty level: 7.70%
- Households with health insurance: 91.20%
-
Migrating professionals grow black middle class in South and West
Jacob Boomsma // Getty Images
- Median household income: $66,519 (4.6% less than U.S. median income)
- Households earning less than $10,000: 18,213 (5.60%)
- Households earning over $200,000: 19,407 (6.00%)
- Median earnings for workers: $39,438 (men: $57,121; women: $45,182)
- Unemployment rate: 2.90%
- Families with income below poverty level: 6.30%
- Households with health insurance: 92.10%
You may also like: Famous consumer brands that no longer exist
-
-
Migrating professionals grow black middle class in South and West
Sean Pavone // Getty Images
- Median household income: $66,559 (4.5% less than U.S. median income)
- Households earning less than $10,000: 251,693 (6.30%)
- Households earning over $200,000: 337,914 (8.40%)
- Median earnings for workers: $37,512 (men: $54,422; women: $45,405)
- Unemployment rate: 5.50%
- Families with income below poverty level: 10.60%
- Households with health insurance: 87.40%
-
Migrating professionals grow black middle class in South and West
Jacob Boomsma // Getty Images
- Median household income: $66,817 (4.2% less than U.S. median income)
- Households earning less than $10,000: 40,806 (5.20%)
- Households earning over $200,000: 53,061 (6.80%)
- Median earnings for workers: $38,898 (men: $56,121; women: $44,037)
- Unemployment rate: 2.70%
- Families with income below poverty level: 6.70%
- Households with health insurance: 92.90%
-
-
Migrating professionals grow black middle class in South and West
Joe Belanger // Getty Images
- Median household income: $66,963 (4.0% less than U.S. median income)
- Households earning less than $10,000: 657,665 (6.10%)
- Households earning over $200,000: 955,952 (8.90%)
- Median earnings for workers: $38,059 (men: $56,100; women: $45,393)
- Unemployment rate: 6.20%
- Families with income below poverty level: 11.00%
- Households with health insurance: 82.00%
-
Migrating professionals grow black middle class in South and West
f11photo // Getty Images
- Median household income: $67,125 (3.7% less than U.S. median income)
- Households earning less than $10,000: 117,547 (4.80%)
- Households earning over $200,000: 160,477 (6.60%)
- Median earnings for workers: $40,678 (men: $57,925; women: $46,762)
- Unemployment rate: 3.50%
- Families with income below poverty level: 6.80%
- Households with health insurance: 94.60%
-
-
Migrating professionals grow black middle class in South and West
Sean Pavone // Getty Images
- Median household income: $68,957 (1.1% less than U.S. median income)
- Households earning less than $10,000: 308,449 (5.90%)
- Households earning over $200,000: 454,003 (8.70%)
- Median earnings for workers: $40,983 (men: $62,096; women: $50,272)
- Unemployment rate: 6.40%
- Families with income below poverty level: 8.30%
- Households with health insurance: 94.50%
You may also like: Do you know the brands behind these famous slogans?
-
Migrating professionals grow black middle class in South and West
Sean Pavone // Getty Images
- Median household income: $69,056 (0.9% less than U.S. median income)
- Households earning less than $10,000: 158,400 (5.60%)
- Households earning over $200,000: 228,651 (8.10%)
- Median earnings for workers: $39,023 (men: $55,458; women: $46,309)
- Unemployment rate: 5.80%
- Families with income below poverty level: 9.10%
- Households with health insurance: 89.30%
-
-
Migrating professionals grow black middle class in South and West
Real Window Creative // Getty Images
- Median household income: $71,091 (2.0% more than U.S. median income)
- Households earning less than $10,000: 20,504 (5.20%)
- Households earning over $200,000: 33,025 (8.30%)
- Median earnings for workers: $41,374 (men: $60,608; women: $51,827)
- Unemployment rate: 5.60%
- Families with income below poverty level: 8.60%
- Households with health insurance: 94.30%
-
Migrating professionals grow black middle class in South and West
Josemaria Toscano // Getty Images
- Median household income: $71,562 (2.6% more than U.S. median income)
- Households earning less than $10,000: 90,749 (5.30%)
- Households earning over $200,000: 153,152 (9.00%)
- Median earnings for workers: $40,063 (men: $60,831; women: $51,057)
- Unemployment rate: 6.40%
- Families with income below poverty level: 7.60%
- Households with health insurance: 93.90%
-
-
Migrating professionals grow black middle class in South and West
Sean Pavone // Getty Images
- Median household income: $72,205 (3.6% more than U.S. median income)
- Households earning less than $10,000: 321,928 (6.40%)
- Households earning over $200,000: 504,727 (10.10%)
- Median earnings for workers: $41,504 (men: $63,819; women: $51,131)
- Unemployment rate: 7.40%
- Families with income below poverty level: 8.60%
- Households with health insurance: 93.00%
-
Migrating professionals grow black middle class in South and West
Sean Pavone // Getty Images
- Median household income: $72,431 (3.9% more than U.S. median income)
- Households earning less than $10,000: 10,992 (4.10%)
- Households earning over $200,000: 23,553 (8.70%)
- Median earnings for workers: $40,249 (men: $55,803; women: $51,931)
- Unemployment rate: 4.20%
- Families with income below poverty level: 6.30%
- Households with health insurance: 96.30%
You may also like: States where food stamps are used the most
-
-
Migrating professionals grow black middle class in South and West
ESB Professional // Getty Images
- Median household income: $74,008 (6.2% more than U.S. median income)
- Households earning less than $10,000: 25,735 (5.80%)
- Households earning over $200,000: 45,324 (10.30%)
- Median earnings for workers: $41,891 (men: $63,219; women: $54,188)
- Unemployment rate: 7.70%
- Families with income below poverty level: 7.00%
- Households with health insurance: 95.70%
-
Migrating professionals grow black middle class in South and West
oneinchpunch // Getty Images
- Median household income: $74,314 (6.6% more than U.S. median income)
- Households earning less than $10,000: 535,006 (7.00%)
- Households earning over $200,000: 987,887 (12.90%)
- Median earnings for workers: $43,462 (men: $67,512; women: $59,869)
- Unemployment rate: 8.70%
- Families with income below poverty level: 10.10%
- Households with health insurance: 94.80%
-
-
Migrating professionals grow black middle class in South and West
f11photo // Getty Images
- Median household income: $77,720 (11.5% more than U.S. median income)
- Households earning less than $10,000: 96,651 (4.20%)
- Households earning over $200,000: 226,903 (9.90%)
- Median earnings for workers: $43,853 (men: $64,611; women: $52,535)
- Unemployment rate: 4.90%
- Families with income below poverty level: 5.50%
- Households with health insurance: 95.50%
-
Migrating professionals grow black middle class in South and West
SCStock // Getty Images
- Median household income: $77,845 (11.7% more than U.S. median income)
- Households earning less than $10,000: 14,625 (5.40%)
- Households earning over $200,000: 27,700 (10.20%)
- Median earnings for workers: $41,962 (men: $62,134; women: $55,285)
- Unemployment rate: 7.00%
- Families with income below poverty level: 7.10%
- Households with health insurance: 88.60%
-
-
Migrating professionals grow black middle class in South and West
Sean Pavone // Getty Images
- Median household income: $79,449 (14.0% more than U.S. median income)
- Households earning less than $10,000: 47,612 (4.30%)
- Households earning over $200,000: 108,131 (9.80%)
- Median earnings for workers: $37,325 (men: $61,269; women: $44,707)
- Unemployment rate: 3.50%
- Families with income below poverty level: 5.90%
- Households with health insurance: 91.00%
You may also like: Most popular grocery stores in America
-
Migrating professionals grow black middle class in South and West
Sean Pavone // Getty Images
- Median household income: $80,963 (16.1% more than U.S. median income)
- Households earning less than $10,000: 167,157 (5.00%)
- Households earning over $200,000: 445,751 (13.40%)
- Median earnings for workers: $43,963 (men: $66,014; women: $53,414)
- Unemployment rate: 4.80%
- Families with income below poverty level: 6.90%
- Households with health insurance: 93.20%
-
-
Migrating professionals grow black middle class in South and West
Andrew Zarivny // Getty Images
- Median household income: $82,254 (18.0% more than U.S. median income)
- Households earning less than $10,000: 110,592 (4.80%)
- Households earning over $200,000: 277,905 (12.00%)
- Median earnings for workers: $44,818 (men: $65,217; women: $54,635)
- Unemployment rate: 5.30%
- Families with income below poverty level: 6.20%
- Households with health insurance: 92.00%
-
Migrating professionals grow black middle class in South and West
Sean Pavone // Getty Images
- Median household income: $83,771 (20.2% more than U.S. median income)
- Households earning less than $10,000: 74,573 (5.20%)
- Households earning over $200,000: 208,195 (14.60%)
- Median earnings for workers: $45,511 (men: $73,022; women: $60,672)
- Unemployment rate: 6.70%
- Families with income below poverty level: 6.70%
- Households with health insurance: 94.80%
-
-
Migrating professionals grow black middle class in South and West
Agnieszka Gaul // Getty Images
- Median household income: $84,247 (20.8% more than U.S. median income)
- Households earning less than $10,000: 145,555 (4.80%)
- Households earning over $200,000: 422,689 (14.00%)
- Median earnings for workers: $46,951 (men: $74,068; women: $57,567)
- Unemployment rate: 5.90%
- Families with income below poverty level: 6.50%
- Households with health insurance: 93.60%
-
Migrating professionals grow black middle class in South and West
Izabela23 // Getty Images
- Median household income: $84,857 (21.7% more than U.S. median income)
- Households earning less than $10,000: 26,535 (5.40%)
- Households earning over $200,000: 65,102 (13.30%)
- Median earnings for workers: $40,595 (men: $61,812; women: $49,816)
- Unemployment rate: 7.70%
- Families with income below poverty level: 8.00%
- Households with health insurance: 96.10%
You may also like: Iconic car debuts from the year you were born
-
-
Migrating professionals grow black middle class in South and West
Lucky-photographer // Getty Images
- Median household income: $84,907 (21.8% more than U.S. median income)
- Households earning less than $10,000: 715,644 (5.30%)
- Households earning over $200,000: 2,082,043 (15.50%)
- Median earnings for workers: $41,891 (men: $65,324; women: $57,373)
- Unemployment rate: 8.30%
- Families with income below poverty level: 9.00%
- Households with health insurance: 93.00%
-
Migrating professionals grow black middle class in South and West
Winston Tan // Getty Images
- Median household income: $88,465 (26.9% more than U.S. median income)
- Households earning less than $10,000: 17,235 (3.10%)
- Households earning over $200,000: 62,138 (11.30%)
- Median earnings for workers: $45,677 (men: $68,566; women: $51,880)
- Unemployment rate: 3.60%
- Families with income below poverty level: 4.80%
- Households with health insurance: 94.90%
-
-
Migrating professionals grow black middle class in South and West
Mia2you // Getty Images
- Median household income: $89,296 (28.1% more than U.S. median income)
- Households earning less than $10,000: 171,737 (4.90%)
- Households earning over $200,000: 584,370 (16.70%)
- Median earnings for workers: $50,021 (men: $75,297; women: $61,802)
- Unemployment rate: 8.10%
- Families with income below poverty level: 7.40%
- Households with health insurance: 92.80%
-
Migrating professionals grow black middle class in South and West
Travellaggio // Getty Images
- Median household income: $89,645 (28.6% more than U.S. median income)
- Households earning less than $10,000: 149,006 (5.40%)
- Households earning over $200,000: 472,304 (17.10%)
- Median earnings for workers: $50,683 (men: $77,636; women: $66,536)
- Unemployment rate: 6.60%
- Families with income below poverty level: 7.10%
- Households with health insurance: 97.50%
-
-
Migrating professionals grow black middle class in South and West
Sean Pavone // Getty Images
- Median household income: $90,088 (29.2% more than U.S. median income)
- Households earning less than $10,000: 30,677 (9.60%)
- Households earning over $200,000: 68,951 (21.60%)
- Median earnings for workers: $72,457 (men: $103,222; women: $87,244)
- Unemployment rate: 8.20%
- Families with income below poverty level: 12.80%
- Households with health insurance: 96.30%
You may also like: 25 richest families in America
-
Migrating professionals grow black middle class in South and West
Sean Pavone // Getty Images
- Median household income: $90,203 (29.4% more than U.S. median income)
- Households earning less than $10,000: 122,990 (5.20%)
- Households earning over $200,000: 355,084 (15.10%)
- Median earnings for workers: $50,548 (men: $71,995; women: $62,190)
- Unemployment rate: 5.90%
- Families with income below poverty level: 7.40%
- Households with health insurance: 93.90%
-
-
More job seekers now know how much they’ll be paid
Canva
Despite persistent inflation, the federal minimum wage remains $7.25 per hour. More than 13 years have passed since Congress last raised the federal minimum wage in 2009, the longest such stretch in American history. While many cities, counties and states across the nation enforce their own minimum wage well above the federal minimum, the cost of living in each can greatly impact just how far those wages can go.
To get a clearer picture of where minimum wage goes the furthest, SmartAsset ranked 79 of the largest U.S. cities based on how much the minimum wage (as of Jan. 1, 2023) is worth after adjusting for the cost of living in each city.
This is SmartAsset's second study on which cities have the highest and lowest real minimum wage. You can read the 2022 edition here.
-
More job seekers now know how much they’ll be paid
Canva
- Minimum wage goes furthest in Denver. After a January 2023 increase, the Colorado capital now has a minimum wage of $17.29 per hour, which ranks second-highest study-wide. However, residents in this city are getting the biggest bang for their buck. The city takes the No. 1 spot for the highest minimum real minimum wage, despite experiencing the 22nd-highest cost of living.
- Minimum wage workers in Seattle earn the most. No city in our study has a higher statutory minimum wage than Seattle, where minimum wage workers earn $18.69 an hour. But Seattle is also among the highest cost-of-living cities in our study. After adjusting for those costs, Seattle's real minimum wage shrinks to $12.51.
- Less than a quarter of cities have a $15 minimum wage. Only 18 out of the 79 cities in our study have a statutory minimum wage of $15 or more. Meanwhile, 30 cities have a minimum wage that defaults to the federal minimum of $7.25, including four of the cities at the bottom of our rankings.
- Cost of living in Orlando closely tracks the national average. While Orlando is best known as the home of Walt Disney World, the cost of living in the city is just 0.2% above the national average. As a result, the city's $11 minimum wage is worth $10.98 after adjusting for cost of living.
-
-
More job seekers now know how much they’ll be paid
SmartAsset
These five cities have adjusted their minimum wage so that hourly employees can make their money go further.
1. Denver, CO
The Mile High City's statutory minimum wage, which rose to $17.29 per hour on Jan. 1, 2023, ranks second-highest among the 79 cities in our study. A city ordinance adopted in 2019 requires Denver's minimum wage to increase each year based on the Consumer Price Index, which tracks the price of goods and services in the economy. After factoring in the cost of living, which is 14.7% higher than the national average, Denver has the highest adjusted minimum wage in our study: $15.07.
2. Spokane, WA
Spokane doesn't have its own minimum wage law, but Washington's statewide minimum wage increased by $1.25 to $15.74 per hour on Jan. 1, 2023. After adjusting for the city's cost of living, which is slightly above the national average, Spokane's minimum wage is worth $15.02.
3. Buffalo, NY
Buffalo may be one of the snowiest cities in the country, but the minimum wage goes the third-furthest out of all 79 cities that were considered for this study. The New York state minimum wage jumped $1 on Dec. 31, 2022, reaching $14.20. However, Buffalo's cost of living is below the national average, making the minimum wage worth $14.92 after adjusting for the city's cost of living.
4. Minneapolis, MN
The minimum wage in Minneapolis increased to $15.19 on Jan. 1, 2023 for large employers, marking it the third increase to the city's statutory minimum since a wage ordinance was approved in 2017. The minimum wage in Minnesota's largest city is now 43% higher than the state-mandated minimum. After adjusting for cost of living in Minneapolis, which is 2.3% above the national average, the minimum wage equals $14.85 per hour.
5. St. Louis, MO
Under a state law that took effect in 2017, municipalities in Missouri cannot institute a minimum wage that's higher than the state minimum. As a result, minimum wage workers in St. Louis earn $12 per hour. However, St. Louis has one of the lowest cost-of-living indexes in our study at 12.3% below the national average. When adjusting for the city's cost of living, the hourly minimum wage in St. Louis is worth $13.68.
-
More job seekers now know how much they’ll be paid
SmartAsset
For workers in these cities, minimum hourly wages come up short when compared to the cost of living.
1. Honolulu, HI (Tie)
Out of the 79 cities in our study, the minimum wage in Honolulu pays for the least. Minimum wage workers earn $12 per hour, but the city's exorbitant cost of living shrinks the purchasing power of those earnings. At 85.6% above the national average, Hawaii's capital city has the third-highest cost of living across our study. That means the hourly minimum wage in Honolulu is actually worth $6.47 when adjusting for cost of living. However, the state-mandated minimum wage will increase $2 in 2024, 2026 and 2028, when it reaches $18.
1. Plano, TX (Tie)
Not only is Plano's cost of living 12.1% higher than the national average, but it has the lowest possible minimum wage. The state of Texas adopts the federal minimum wage of $7.25 an hour, rather than instituting its own higher wage. After adjusting for the cost of living in this suburb of Dallas, Plano's minimum wage is worth just $6.47.
3. New Orleans, LA
While New Orleans raised the minimum wage for city workers to $15 an hour in 2022, other workers are subject to the federal minimum wage of $7.25. With the cost of living 10.8% higher than the national average, the minimum wage is worth only $6.54 in New Orleans.
4. Philadelphia, PA
The minimum wage in Pennsylvania, which mirrors the federal minimum, hasn't risen since 2009. Gov. Josh Shapiro has called for a $15 minimum wage, which would presumably help minimum wage workers in the state's largest city contend with a cost of living that's 8.4% higher than the national average. As a result, the minimum wage in Philadelphia is worth $6.69 after adjusting for the city's cost of living, making it one of the places where the minimum wage is worth the least.
5. Atlanta, GA
Like Texas, Louisiana and Pennsylvania, minimum wage workers in Georgia only earn the federal minimum. In Atlanta, the cost of living is 6.6% above the national average. The minimum wage is worth only $6.80 after adjusting for cost of living, the fifth-lowest across our study.
-
-
More job seekers now know how much they’ll be paid
SmartAsset
SmartAsset collected state and city minimum wages across the country, pulling data from minimumwage.com and government websites. We then adjusted the applicable minimum wage for 79 of the largest cities in the U.S., according to the local cost of living, using data from the Council for Community and Economic Research. The cost of living takes into account the price of housing, groceries, utilities, transportation and miscellaneous goods and services.
For example, the statutory minimum wage in Los Angeles is $16.04 per hour, but the cost of living is 48% higher than the national average. To calculate the city's adjusted minimum wage, we divided the city's statutory minimum wage by 1.48. As a result, in terms of purchasing power, the minimum wage in the City of Angels is just $10.84.
In our analysis, we used the minimum wage as of Jan. 1, 2023. In cases where cities differentiate between small and large employer minimum wage rates, we considered the minimum wage rate required for large employers. Additionally, for cities and states that distinguish between jobs offering health benefits and those that do not, we used the minimum wage for jobs that do not offer qualifying health benefits.
This story originally appeared on SmartAsset and has been independently reviewed to meet journalistic standards.
In 2021, the median pay for full-time women workers was about 83% of men’s pay, according to federal data, and women make less than their male counterparts in nearly all fields. Black women make 64 cents for every dollar paid to white, non-Hispanic men, according to a report by the National Partnership for Women and Families. Latina women make 54 cents and Native American women 51 cents.
Keegan Vance Forte, 37, a freelancer based in Jersey City, New Jersey, is looking for a permanent position either in New York or New Jersey. She said she’s noticed more salary listings for open roles in both states during the past several months than she did when job hunting in the past. (New Jersey does not have a law requiring transparency. New York City’s law, which requires employers to post a good-faith salary range with every posting, took effect in November.)
“I’m still getting used to it,” she said. “When I see a salary posting with a job listing, my eyes widen.”
In the past decade, Forte has held roles in business development, marketing and company partnerships, and she says knowing the available range is helpful to avoid wasting both her time and the hiring manager’s.
“Instead of dancing around the elephant-in-the-room question at the end, you at least know you’re playing in the same ballpark,” she said.
Previously, Forte has spent weeks interviewing for a position only to discover the salary wasn’t in an acceptable range for her.
“Over a career, that can be very time consuming,” she said.
Daniel Zhao, lead economist for job site GlassDoor, said that compliance with the new laws requiring disclosure is already strong in New York City, California, and Washington, and even stronger in Colorado, which has had a law mandating transparency in effect since 2019.
“The additional compliance in Colorado implies it will improve in the other states,” he said. “And what we’re really noticing is that, since the laws have taken effect, more employers have decided to share salaries nationwide.”
Major companies including Microsoft, CitiGroup, and Google have publicly committed to posting salary ranges for all jobs across the country, rather than only in the states where it’s legally required.
“Companies that are not necessarily in locations that now have laws — they’re disclosing that information anyway,” said Vicki Salemi, a career expert at job site Monster. “It’s becoming more of the norm because job-seekers are expecting it.”
Salemi, who also previously worked as a recruiter, said employers tend to compete for job candidates across state lines, including neighboring states that have different laws.
“That means it’s in their best interest to start sharing their own ranges, so the job seekers can compare apples to apples,” she said. “It’s a virtuous feedback loop.”
She called the new laws a “game-changer” in reducing the taboo around discussing pay.
In New York City, the NYC Commission on Human Rights is early in its enforcement efforts. But Jose Rios Lua, the commission’s executive director of communications, said that the new law has been “life-changing for a lot of folks.”
“Before they’ve gone through what could turn out to be a long application process, they know the salary range, so they know if a position is worth pursuing,” he said. “For those in lower-earning jobs, it might mean the difference from living paycheck to paycheck.”
