Research shows people blame and judge parents for children’s heavier weights
Jaimie Arona Krems, Assistant Professor of Psychology, Oklahoma State University;
Devanshi Patel, Ph.D. Candidate in Clinical Psychology, Oklahoma State University
The Research Brief is a short take about interesting academic work.
The more a person views parents as responsible for a child’s excess weight, the more likely they are to view such parents as bad parents who are lazy, overindulgent and incompetent.
Would you hold the mother responsible for her daughter’s weight?Courtesy of Steve Neuberg, Arizona State University, and Jaimie Krems, Oklahoma State University
Why it matters
In the U.S., about 1 in 3 children have body mass indexes that would be categorized as overweight or obese. The number has grown during the COVID-19 pandemic, meaning an increasing number of parents face stigma on account of their child’s weight.
This parental weight stigma is just beginning to receive serious scientific attention but could have major effects on parents, children and families.
For example, family courtsacross the U.S. and internationally have removed children with obesity from parental custody in large part due to their children’s weights. Family separation can have massive negative effects on children. Our work suggests that if judges react as our study participants did, they may view parents of heavier children as being bad parents simply because their children are heavier.
If people blame and stigmatize parents of children with higher weights, what effects does it have on parents, on their children and on the parent-child interactions that are so important for healthy development?
We do not yet know, for example, if heavier children are aware people stigmatize their parents. If so, these children might not only be ashamed of their size, but also might erroneously feel responsible for how people treat their parents.
We randomly assigned participants to view one of four line drawings depicting a mother or father next to an 8-year-old daughter or son. We also included a short description of the parent and child.
In two of the line drawings and descriptions, the child was described and depicted as “healthy”-weight. In the other two, the child was depicted and described as having “obesity.” The parents were always depicted and described as being healthy-weight. This allowed us to conclude that study participants’ reactions to parents were due to their children’s weights, not the parents’.
We asked participants a few short questions about how good or bad a parent they thought the adult was. Participants also answered questions about what they believed influenced the child’s weight (as well as their academic performance and athleticism, to help obscure the focus of the study). Participants were given 100 “responsibility points” to allot to four factors that could be behind the child’s weight: parent behavior, child behavior, genetic factors and societal factors.
As expected, people who viewed the child with obesity assigned more responsibility points to parent behavior and saw that parent as a worse parent. We found parent and child gender made little difference, consistent with other work.
This is consistent with previous research showing people blame parents for children’s obesity more than people blame society or the kids themselves.
We also tested whether providing alternative explanations for the child’s weight would decrease the amount of blame parents received for it. When we told participants the child had a thyroid condition that caused her excess weight, they stigmatized the mother less, holding her less responsible.
Next, our team is exploring how parents’ own weight, income and race/ethnicity influences the stigma directed toward them on account of their child’s excess weight.
___
The authors do not work for, consult, own shares in or receive funding from any company or organisation that would benefit from this article, and have disclosed no relevant affiliations beyond their academic appointment.
___
Adult obesity surpassed 42%. Here’s how it varies between population groups
A complex constellation of social factors goes into predicting whether someone will or will not have obesity, among them income, education, race, age, and regional demography. Ro used data from the Centers for Disease Control and Prevention (CDC) to break down obesity rates among states (including Washington D.C.), regions, education level, age, and race, using data from 2020, the most recent available. A closer look behind the data reveals just how much social factors influence what kinds of food people have access to and how much physical activity they get—two factors that highly influence obesity levels.
In particular, researchers have found strong inverse correlations between income and obesity, with those with fewer resources being more likely to have obesity. Regions with higher levels of poverty have higher rates of obesity, and this can be true across different racial groups. The COVID-19 pandemic has also increased obesity rates, with more Americans reporting sedentary behavior during the pandemic due to not leaving their homes as much and fitness centers being closed in the early months of COVID-19's spread.
There are numerous health implications of obesity, as those who are obese are more likely to develop diabetes, hypertension, heart issues, high blood pressure, stroke, anxiety, depression, and body pain. These individuals are even more susceptible to contracting severe cases of COVID-19.
It is important to note that being underweight can also come with its own set of health complications, such as malnutrition, anemia, and decreased immune function.
Keep reading for a closer look at how adult obesity varies by population group across the United States.
Adult obesity surpassed 42%. Here’s how it varies between population groups
Canva
States with the highest obesity rates:
- Mississippi: 39.7%
- West Virginia: 39.1%
- Alabama: 39.0%
States with the lowest obesity rates:
- Colorado: 24.2%
- Washington, D.C.: 24.3%
- Massachusetts: 24.4%
The states with the highest obesity rates are all in the American South, while those with the lowest are in the Northeast and Mountain West. Southern food has a reputation for being high in fat and heavy on fried foods, which may contribute to the high levels of obesity.
The South also has higher rates of poverty in the country than elsewhere, and poverty correlates with obesity. Conversely, many of the states with the lowest obesity rates are known for high levels of physical activity. Colorado is famous for its outdoor culture, including its hiking trails, bike paths, and climbing rocks. Washington D.C. is full of running routes around the Washington Monument, bike paths through the city, and nearby hiking trails. Meanwhile, Massachusetts' government initiatives around healthy eating, physical activity, and healthy food financing get high marks.
Adult obesity surpassed 42%. Here’s how it varies between population groups
Canva
Average obesity rates in every region:
- Midwest: 34.1%
- South: 34.1%
- West: 29.3%
- Northeast: 28.0%
The South and the Midwest have the highest obesity rates in the nation by several percentage points. In the Midwest, researchers have found more fast food is consumed here than in other regions, which leads to a higher intake of calories overall.
In the South, many experts point to poverty as a leading cause of obesity, explaining that the region’s high poverty rates lead to the consumption of more calorie-dense foods—such as ramen noodles and frozen pizzas—which tend to be cheaper than fruits, vegetables, and lean proteins. The Northeast, meanwhile, has many of the highest per capita income states in the country, which is correlated with healthier eating habits. The West and the Northeast have strong cultures of fitness—particularly in the West, with its vast swathes of outdoor space.
Adult obesity surpassed 42%. Here’s how it varies between population groups
Canva
Average obesity rates for different age groups:
- 20 to 39 years: 40.0%
- 40 to 59 years: 44.8%
- 60 and older: 42.8%
Obesity rates are highest among middle-aged Americans ages 40 to 59. These years may overlap with the years of most responsibility for many Americans. These are years when they are more likely to be juggling the responsibilities of managerial roles at work, along with the duties of child care and family. This may leave them with less time to get physically active and cook healthy meals. Younger Americans under 40 may not yet have all of these responsibilities, and therefore may be more likely to have time to make healthy eating and activity choices. Obesity is increasing in prevalence among older Americans, and may also be in part related to the decrease in metabolic function over time that makes it harder to burn calories.
Adult obesity surpassed 42%. Here’s how it varies between population groups
Canva
Average obesity rates for different levels of education:
- Adults without a high school degree or equivalent: 38.8%
- High school graduates: 34.0%
- Adults with some college: 34.1%
- College graduates: 25.0%
Obesity is inversely correlated with education levels. One reason this may be is because education is highly correlated with income, and income is correlated with obesity.
Those with fewer resources are less likely to have the time to cook healthy meals, join a gym, take a fitness class, or purchase healthy food. Those with high levels of education may have received basic biological and health information to help them make informed choices that those with lower levels of education may never receive. And the higher a person's income, the more likely their ability to pay for healthy foods and gym memberships.
Adult obesity surpassed 42%. Here’s how it varies between population groups
Canva
Average obesity rates for different races:
- Asian: 13.5%
- White: 30.1%
- Hispanic: 34.0%
- Black: 38.9%
Racial disparities in obesity are extreme in the United States. Asian Americans have the lowest rate of obesity in the country by far—a fact that may be explained in part by an overall healthy pattern of behaviors. Researchers have found that Asian Americans are less likely to smoke, drink, or have hypertension or chronic stress than other groups.
On the other end of the spectrum, Black Americans have higher rates of obesity due to a confluence of social factors. Among them include having less access to stable housing, places with healthy food, and spaces for physical activity, in addition to lower rates of education and income.
This story originally appeared on Ro and was produced and distributed in partnership with Stacker Studio.

 Would you hold the mother responsible for her daughter’s weight? Courtesy of Steve Neuberg, Arizona State University, and Jaimie Krems, Oklahoma State University
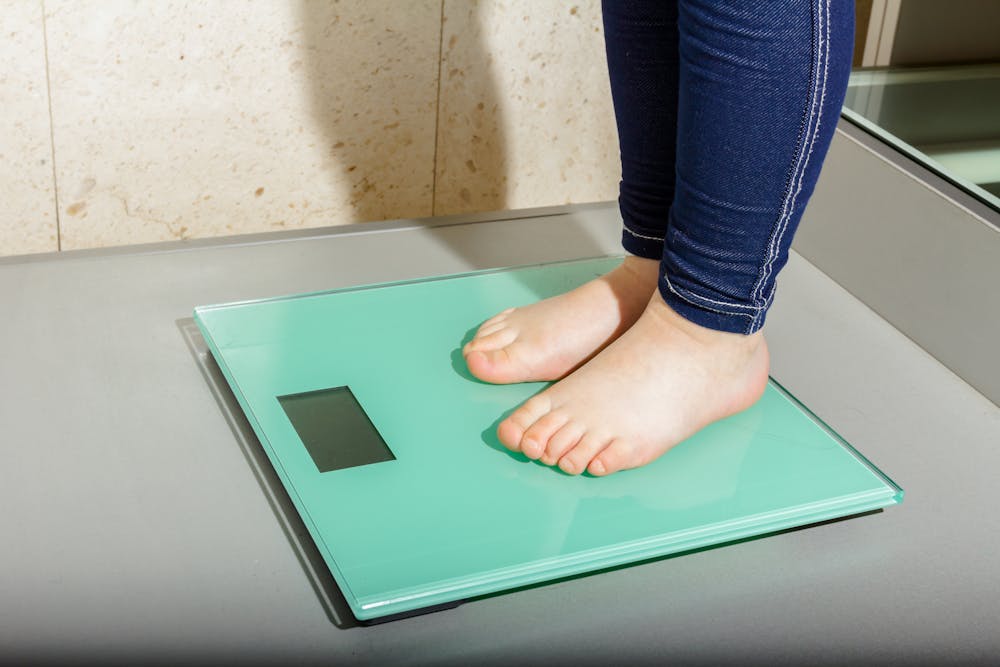 Everyone loses in the blame game. roman023/iStock via Getty Images Plus
 Canva
Canva