
What are the pros and cons of E15 gas? Here’s what to know about Biden’s order
Rising prices for gas, food squeeze U.S. consumers
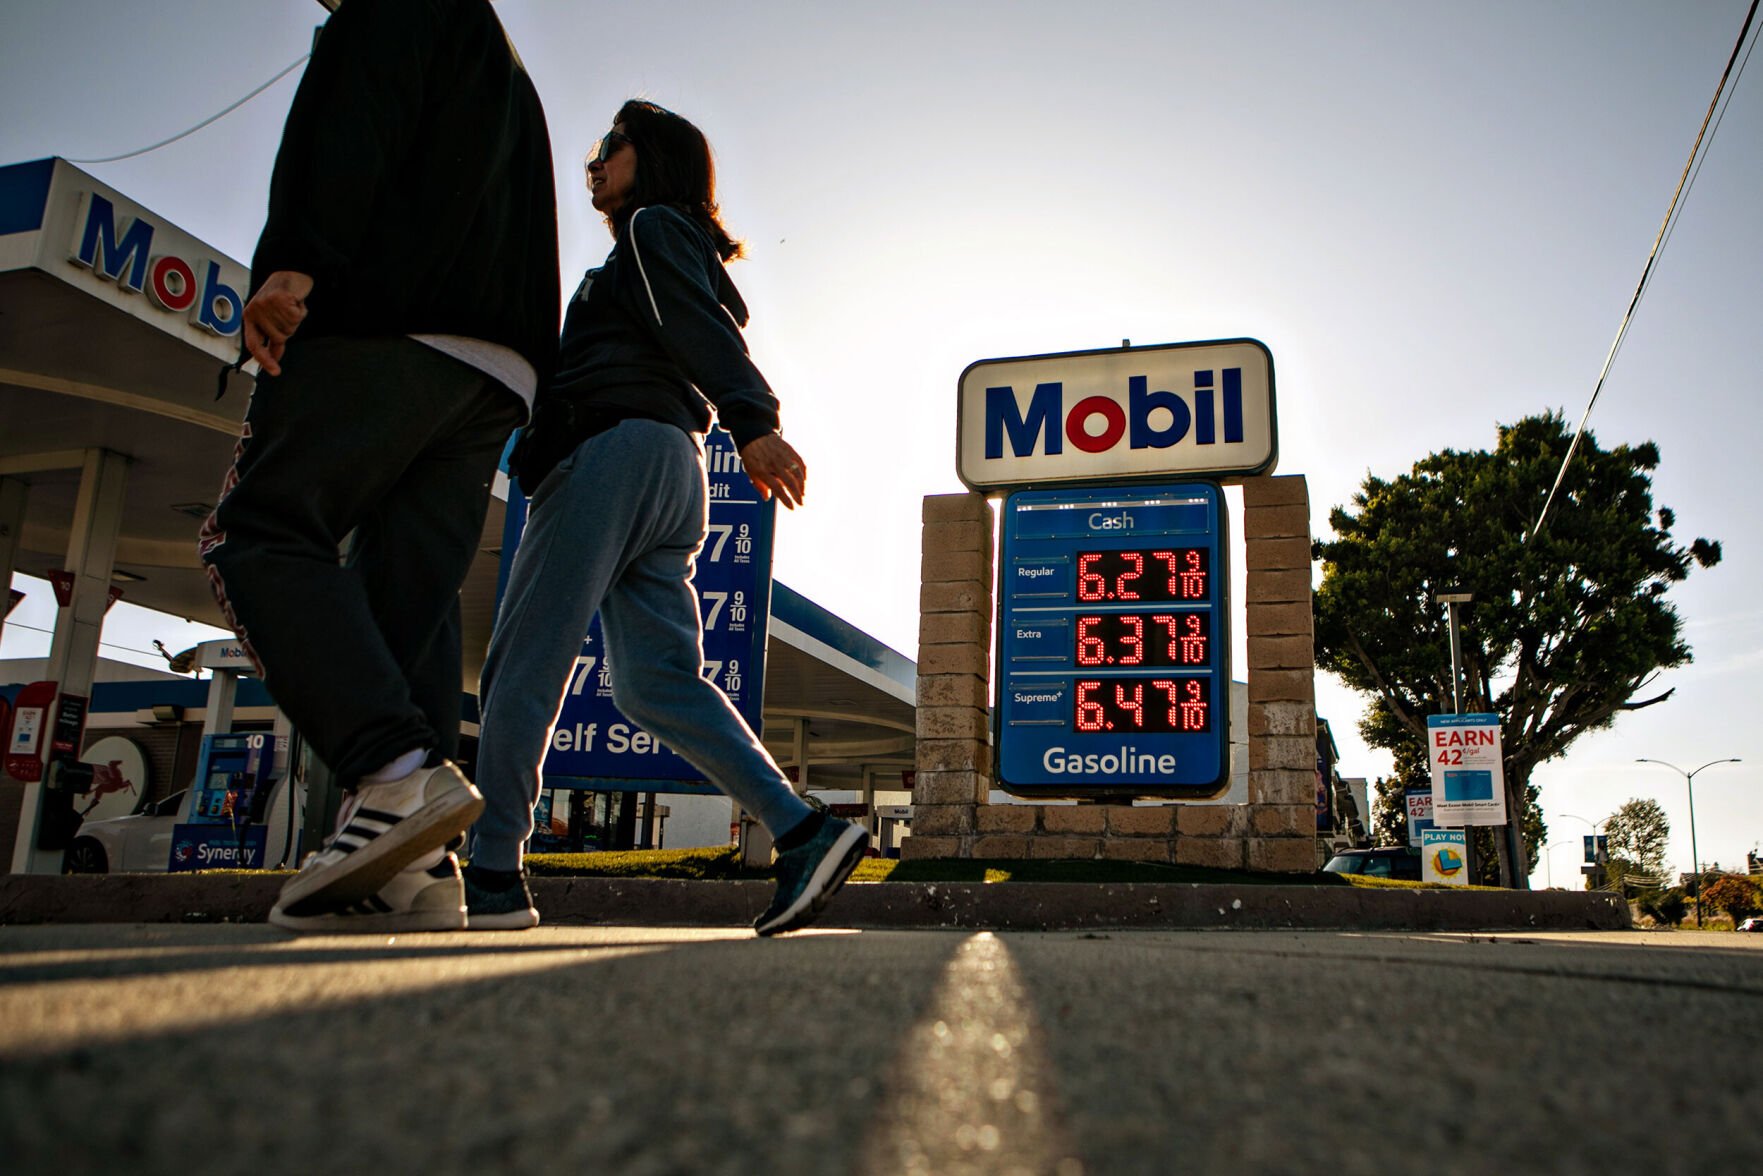
President Joe Biden will announce Tuesday that his administration will lift the summertime ban on E15 gasoline to help ease high gas prices.
Will this action save drivers a significant — or even noticeable — amount of money at the pump? Experts tell CNN it depends on a number of factors, including when your car was made, how fuel efficient it is to begin with and even your driving behavior.
But more ethanol in gas tanks this summer could mean more smog, which is a health risk, particularly for people with respiratory illness.
Here’s what to know about E15.
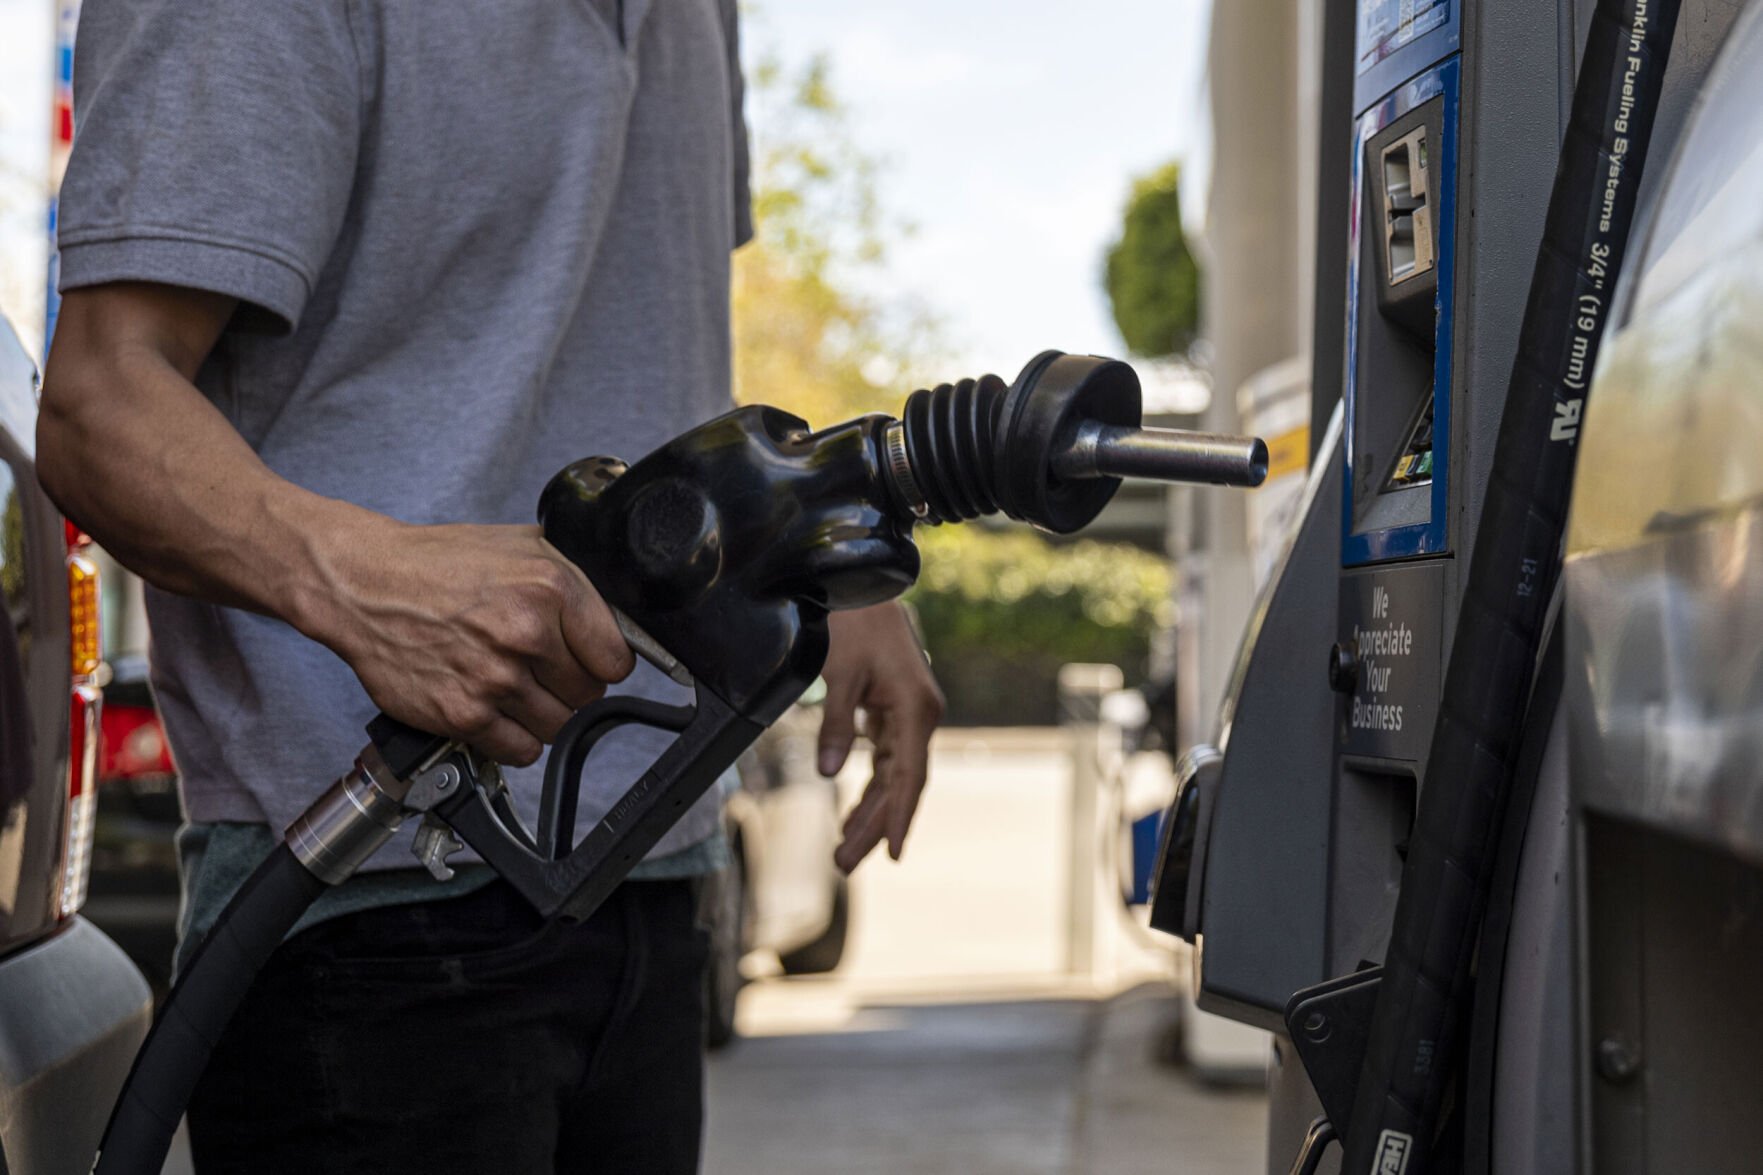
What is E15 fuel and can all vehicles use it?
E15 is a mix of regular gasoline and a smaller amount of ethanol, a plant-based fuel typically made from corn in the US. The “15” in the name means that it includes 15% ethanol.
Even regular gasoline typically has up to a 10% ethanol blend, so E15 is just more biofuel in your gas. The logic behind Biden’s order is that gas that requires less crude oil — which is very expensive right now — could help ease high gas prices.
E15 is safe for most cars manufactured in 2001 or later, and most car companies say it’s fine to use. However, some car manufacturers recommend not using it for certain models.
To be completely sure, GasBuddy’s head of petroleum analysis Patrick De Haan said car owners should consult their owner’s manuals before filling up on E15, especially to ensure you’re not doing something that could void your car’s warranty later on.
Other gas-powered things that cannot use E15, according to the Department of Energy: Motorcycles, heavy-duty vehicles, boats, snowmobiles, chainsaws and gasoline lawn mowers. And if you own a passenger vehicle made before 2001, you shouldn’t use E15 in it.
Jason Armond/Los Angeles Times/Getty Images
The average price of a gallon of gas in the US was around $4.10 on April 12, according to AAA.
How much cheaper will E15 gas be?
The Biden administration estimates gas prices will be on average about 10 cents cheaper after EPA waives E15 during the summer months. De Haan estimated that realistic savings at the pump could range from 5-10 cents.
That might not be enough to counter the severe spike in gas prices that have been slow to come back down even as the price of crude has fallen. But even if it doesn’t feel like real relief, De Haan underscored that every little bit can help consumers.
“It’s something,” he said. “Everyone’s going to be different, and I think most Americans will scoff at 5 to 10 cents, but it’s real savings. It’s not going to feel like much relief but it’s another option and it’s good to have options.”
Filling up the car from empty to full, drivers could be looking at anywhere from 45 cents to $1 total savings for small cars with small gas tanks. For the largest vehicles, savings could be around $2 or $3.
David Paul Morris/Bloomberg/Getty Images
The Biden administration estimates gas prices will be on average about 10 cents cheaper after EPA waives E15 during the summer months.
Is E15 gas as efficient as regular?
In short: Your mileage may vary.
E15 gas contains slightly less energy than standard E10 gasoline, according to a 2009 study from the federal government. This means you’re going to get slightly lower fuel economy with E15, which means you could need to fill up more frequently.
But De Haan said the impact probably won’t be noticeable.
“Because it’s only a 5% increase in the concentration of ethanol in gasoline, there’s basically a negligible hit to fuel mileage,” De Haan said. “There is slightly less energy content. Things that could overpower the difference are things like weather, the wind, how fast the consumer is driving.”
Why is E15 usually banned in the summer?
E15 is meant to be a cleaner form of gasoline because it includes biofuel — which is considered “carbon neutral” — and it does burn cleaner than 100% gasoline. But using it actually creates more ground-level air pollution.
Ethanol is essentially alcohol — and because alcohol evaporates more quickly, that means putting more ethanol into gasoline makes the fuel evaporate more quickly. So, when gasoline is blended with ethanol, the resulting fuel becomes more volatile, evaporates more easily, and those evaporated particles react with sunlight to create smog, a hazardous form of air pollution.
This is why the EPA implemented a summertime ban on E15, the thinking being more heat and sunlight = more evaporation = more smog.
“When gas is exposed to sunlight, especially in summer months — it’s converted into ozone smog,” said Dan Becker, director of the Safe Climate Transport Campaign at the Center for Biological Diversity.
-
Earth Talk: What are the main contaminants we have to worry about in our drinking water?voyata // Shutterstock
The quality of air inhaled isn’t something Americans consciously think about every day, but World Health Organization research reveals that 92% of the global population lives in places with unhealthy air quality.
Air pollution can come from transportation, coal-fired power plants, industrial activity, and other human-perpetuated activity as well as natural events like dust storms and wildfires. These invisible pollutants in the air can create smog and acid rain and can lead to serious health problems. Air pollution causes about 1 in 8 deaths worldwide and accounts for many instances of chronic respiratory disease, lung cancer, strokes, and heart attacks. Ozone, which is the main ingredient in smog, can also increase the risk of asthma.
But it’s not all bad news. Since the United States enacted the Clean Air Act in 1970, aggregate emissions of the six most common pollutants have dropped by 73%. Between 2000 and 2015, concentrations of contaminants in the United States have fallen 40% for fine particle concentrations over 24 hours and 34% for coarse particle concentration. The Clean Air Act also set new emissions standards for cars and trucks, improving the carbon monoxide levels in the air.
The Environmental Protection Agency (EPA) collects air quality data for cities throughout the country and compiles the results into an annual report. Using data from the EPA’s 2019 Outdoor Air Quality report released in May 2020, Stacker determined 50 U.S. cities with the cleanest air.
Stacker ranked the top 50 cities by the annual average amount of coarse particulate matter or particles between 2.5 and 10 micrometers in 2019. Particulate matter between 2.5 and 10 micrometers, referred to as “PM10,” is considered coarse, and cities with lower average amounts of PM10 have cleaner air.
It’s important to note that the annual mean amounts of fine inhalable particles smaller than 2.5 micrometers, referred to as “PM2.5,” were included in the slide data, but were not factored into city rankings. Exceptional events data—such as wildfires—was excluded so that rankings would be determined by the typical air quality in each city, and not by unusual events and outliers.
The EPA’s National Ambient Air Quality Standards referenced in this piece are 150 ug/m3 for coarse particulate matter (PM10) and 12 ug/m3 for fine particulate matter (PM2.5) over 24 hours.
Read on to find out the top 50 U.S. cities that boast the cleanest air.
You may also like: How climate change has affected each state
voyata // ShutterstockThe quality of air inhaled isn’t something Americans consciously think about every day, but World Health Organization research reveals that 92% of the global population lives in places with unhealthy air quality.
Air pollution can come from transportation, coal-fired power plants, industrial activity, and other human-perpetuated activity as well as natural events like dust storms and wildfires. These invisible pollutants in the air can create smog and acid rain and can lead to serious health problems. Air pollution causes about 1 in 8 deaths worldwide and accounts for many instances of chronic respiratory disease, lung cancer, strokes, and heart attacks. Ozone, which is the main ingredient in smog, can also increase the risk of asthma.
But it’s not all bad news. Since the United States enacted the Clean Air Act in 1970, aggregate emissions of the six most common pollutants have dropped by 73%. Between 2000 and 2015, concentrations of contaminants in the United States have fallen 40% for fine particle concentrations over 24 hours and 34% for coarse particle concentration. The Clean Air Act also set new emissions standards for cars and trucks, improving the carbon monoxide levels in the air.
The Environmental Protection Agency (EPA) collects air quality data for cities throughout the country and compiles the results into an annual report. Using data from the EPA’s 2019 Outdoor Air Quality report released in May 2020, Stacker determined 50 U.S. cities with the cleanest air.
Stacker ranked the top 50 cities by the annual average amount of coarse particulate matter or particles between 2.5 and 10 micrometers in 2019. Particulate matter between 2.5 and 10 micrometers, referred to as “PM10,” is considered coarse, and cities with lower average amounts of PM10 have cleaner air.
It’s important to note that the annual mean amounts of fine inhalable particles smaller than 2.5 micrometers, referred to as “PM2.5,” were included in the slide data, but were not factored into city rankings. Exceptional events data—such as wildfires—was excluded so that rankings would be determined by the typical air quality in each city, and not by unusual events and outliers.
The EPA’s National Ambient Air Quality Standards referenced in this piece are 150 ug/m3 for coarse particulate matter (PM10) and 12 ug/m3 for fine particulate matter (PM2.5) over 24 hours.
Read on to find out the top 50 U.S. cities that boast the cleanest air.
You may also like: How climate change has affected each state
-
Earth Talk: What are the main contaminants we have to worry about in our drinking water?Sammy Graphiking // Shutterstock
- Average coarse particulate matter (PM10): 14 μg/m^3
- Second-highest average coarse particulate matter (PM10): 35 μg/m^3 (328.6% below EPA standard)
- Average fine particulate matter (PM2.5): 5.9 μg/m^3 (103.4% below EPA standard)
Unlike its neighbor to the north, where the oil and gas industry has adversely affected air quality in wide swaths of the state, South Dakota has remained mostly clear. And particulate pollution is improving: The current average annual PM10 in Aberdeen is down from 21 μg/m^3 in 2012.
Sammy Graphiking // Shutterstock- Average coarse particulate matter (PM10): 14 μg/m^3
- Second-highest average coarse particulate matter (PM10): 35 μg/m^3 (328.6% below EPA standard)
- Average fine particulate matter (PM2.5): 5.9 μg/m^3 (103.4% below EPA standard)
Unlike its neighbor to the north, where the oil and gas industry has adversely affected air quality in wide swaths of the state, South Dakota has remained mostly clear. And particulate pollution is improving: The current average annual PM10 in Aberdeen is down from 21 μg/m^3 in 2012.
-
-
Earth Talk: What are the main contaminants we have to worry about in our drinking water?James Andrews1 // Shutterstock
- Average coarse particulate matter (PM10): 14 μg/m^3
- Second-highest average coarse particulate matter (PM10): 43 μg/m^3 (248.8% below EPA standard)
- Average fine particulate matter (PM2.5): 7.9 μg/m^3 (51.9% below EPA standard)
From 2007 to 2017, the pounds of air pollution released in Bridgeport, Connecticut, decreased by a whopping 90%, while Stamford, Connecticut, experienced a similarly impressive 68% decline. The state has taken efforts to combat air pollution, including updating wastewater plants and putting scrubbers on smokestacks.
James Andrews1 // Shutterstock- Average coarse particulate matter (PM10): 14 μg/m^3
- Second-highest average coarse particulate matter (PM10): 43 μg/m^3 (248.8% below EPA standard)
- Average fine particulate matter (PM2.5): 7.9 μg/m^3 (51.9% below EPA standard)
From 2007 to 2017, the pounds of air pollution released in Bridgeport, Connecticut, decreased by a whopping 90%, while Stamford, Connecticut, experienced a similarly impressive 68% decline. The state has taken efforts to combat air pollution, including updating wastewater plants and putting scrubbers on smokestacks.
-
Earth Talk: What are the main contaminants we have to worry about in our drinking water?Richard345 // Shutterstock
- Average coarse particulate matter (PM10): 14 μg/m^3
- Second-highest average coarse particulate matter (PM10): 27 μg/m^3 (455.6% below EPA standard)
- Average fine particulate matter (PM2.5): 8.7 μg/m^3 (37.9% below EPA standard)
There are seven coal-fired power plants within 30 miles of Evansville, Indiana, and local advocacy groups have long been fighting to hold them accountable for their emissions. A recent settlement between American Electric Power and the EPA, citizen groups and eight states resulted in a $3.5 million investment in improving air quality in Indiana.
Richard345 // Shutterstock- Average coarse particulate matter (PM10): 14 μg/m^3
- Second-highest average coarse particulate matter (PM10): 27 μg/m^3 (455.6% below EPA standard)
- Average fine particulate matter (PM2.5): 8.7 μg/m^3 (37.9% below EPA standard)
There are seven coal-fired power plants within 30 miles of Evansville, Indiana, and local advocacy groups have long been fighting to hold them accountable for their emissions. A recent settlement between American Electric Power and the EPA, citizen groups and eight states resulted in a $3.5 million investment in improving air quality in Indiana.
-
-
Earth Talk: What are the main contaminants we have to worry about in our drinking water?TLF Images // Shutterstock
- Average coarse particulate matter (PM10): 14 μg/m^3
- Second-highest average coarse particulate matter (PM10): 78 μg/m^3 (92.3% below EPA standard)
- Average fine particulate matter (PM2.5): 6.5 μg/m^3 (84.6% below EPA standard)
Windy, open spaces are great for air quality, since air pollution can just blow away. Although it occasionally gets hit with wildfire smoke from further west, Fargo, North Dakota, has earned A ratings in recent years from the American Lung Association’s annual report.
TLF Images // Shutterstock- Average coarse particulate matter (PM10): 14 μg/m^3
- Second-highest average coarse particulate matter (PM10): 78 μg/m^3 (92.3% below EPA standard)
- Average fine particulate matter (PM2.5): 6.5 μg/m^3 (84.6% below EPA standard)
Windy, open spaces are great for air quality, since air pollution can just blow away. Although it occasionally gets hit with wildfire smoke from further west, Fargo, North Dakota, has earned A ratings in recent years from the American Lung Association’s annual report.
-
Earth Talk: What are the main contaminants we have to worry about in our drinking water?Sean Pavone // Shutterstock
- Average coarse particulate matter (PM10): 14 μg/m^3
- Second-highest average coarse particulate matter (PM10): 52 μg/m^3 (188.5% below EPA standard)
- Average fine particulate matter (PM2.5): 7.7 μg/m^3 (55.8% below EPA standard)
Air pollution in Connecticut has dropped significantly in the past decade, according to the EPA. Between 2007 and 2017, land, water, and air pollution in Connecticut dropped by an impressive 57%. The drop in pollution levels is partly due to industrial facilities implementing 4,000 new pollution source reduction activities that have limited chemical waste.
You may also like: States with the most severe summer weather
Sean Pavone // Shutterstock- Average coarse particulate matter (PM10): 14 μg/m^3
- Second-highest average coarse particulate matter (PM10): 52 μg/m^3 (188.5% below EPA standard)
- Average fine particulate matter (PM2.5): 7.7 μg/m^3 (55.8% below EPA standard)
Air pollution in Connecticut has dropped significantly in the past decade, according to the EPA. Between 2007 and 2017, land, water, and air pollution in Connecticut dropped by an impressive 57%. The drop in pollution levels is partly due to industrial facilities implementing 4,000 new pollution source reduction activities that have limited chemical waste.
You may also like: States with the most severe summer weather
-
-
Earth Talk: What are the main contaminants we have to worry about in our drinking water?lizada Studios // Shutterstock
- Average coarse particulate matter (PM10): 13 μg/m^3
- Second-highest average coarse particulate matter (PM10): 31 μg/m^3 (383.9% below EPA standard)
- Average fine particulate matter (PM2.5): 8.5 μg/m^3 (41.2% below EPA standard)
The air in Pennsylvania’s Lehigh Valley is gradually becoming cleaner. Allentown, Pennsylvania, and its surrounding areas in 2017 measured its lowest-ever ozone levels as well as daily and yearly average particle pollution. Officials say the area’s geography and emission sources hinder more drastic improvements in air quality.
lizada Studios // Shutterstock- Average coarse particulate matter (PM10): 13 μg/m^3
- Second-highest average coarse particulate matter (PM10): 31 μg/m^3 (383.9% below EPA standard)
- Average fine particulate matter (PM2.5): 8.5 μg/m^3 (41.2% below EPA standard)
The air in Pennsylvania’s Lehigh Valley is gradually becoming cleaner. Allentown, Pennsylvania, and its surrounding areas in 2017 measured its lowest-ever ozone levels as well as daily and yearly average particle pollution. Officials say the area’s geography and emission sources hinder more drastic improvements in air quality.
-
Earth Talk: What are the main contaminants we have to worry about in our drinking water?f11photo // Shutterstock
- Average coarse particulate matter (PM10): 13 μg/m^3
- Second-highest average coarse particulate matter (PM10): 34 μg/m^3 (341.2% below EPA standard)
- Average fine particulate matter (PM2.5): 8.5 μg/m^3 (41.2% below EPA standard)
Although Baltimore City and Baltimore County have work to do on reducing smog, the city was given a B grade for the amount of soot in the air, while the county was given an A grade. However, Baltimore fared worse in terms of ozone, landing in the #17 spot among cities with the highest ozone days. In Howard County, which is home to Columbia, Maryland, the soot grade was also an A.
f11photo // Shutterstock- Average coarse particulate matter (PM10): 13 μg/m^3
- Second-highest average coarse particulate matter (PM10): 34 μg/m^3 (341.2% below EPA standard)
- Average fine particulate matter (PM2.5): 8.5 μg/m^3 (41.2% below EPA standard)
Although Baltimore City and Baltimore County have work to do on reducing smog, the city was given a B grade for the amount of soot in the air, while the county was given an A grade. However, Baltimore fared worse in terms of ozone, landing in the #17 spot among cities with the highest ozone days. In Howard County, which is home to Columbia, Maryland, the soot grade was also an A.
-
-
Earth Talk: What are the main contaminants we have to worry about in our drinking water?refrina // Shutterstock
- Average coarse particulate matter (PM10): 13 μg/m^3
- Second-highest average coarse particulate matter (PM10): 30 μg/m^3 (400.0% below EPA standard)
- Average fine particulate matter (PM2.5): Data not available
Fayetteville, North Carolina, was one of just 14 cities that didn’t see any “unhealthy air days” in 2019, according to the American Lung Association’s annual report. In addition to ranking well for particulate pollution, the city also has consistently low ozone levels.
refrina // Shutterstock- Average coarse particulate matter (PM10): 13 μg/m^3
- Second-highest average coarse particulate matter (PM10): 30 μg/m^3 (400.0% below EPA standard)
- Average fine particulate matter (PM2.5): Data not available
Fayetteville, North Carolina, was one of just 14 cities that didn’t see any “unhealthy air days” in 2019, according to the American Lung Association’s annual report. In addition to ranking well for particulate pollution, the city also has consistently low ozone levels.
-
Earth Talk: What are the main contaminants we have to worry about in our drinking water?Malgosia S // Shutterstock
- Average coarse particulate matter (PM10): 13 μg/m^3
- Second-highest average coarse particulate matter (PM10): 50 μg/m^3 (200.0% below EPA standard)
- Average fine particulate matter (PM2.5): 8.3 μg/m^3 (44.6% below EPA standard)
Grand Rapids, Michigan, is home to the West Michigan Clean Air Coalition, which declares a “Clean Air Action Day” when air pollutants reach a higher-than-normal level that could affect those with sensitivities. On a Clean Air Action Day, residents are asked to reduce their emissions by carpooling, taking public transportation, and delaying refueling or mowing lawns to improve the region’s air quality.
Malgosia S // Shutterstock- Average coarse particulate matter (PM10): 13 μg/m^3
- Second-highest average coarse particulate matter (PM10): 50 μg/m^3 (200.0% below EPA standard)
- Average fine particulate matter (PM2.5): 8.3 μg/m^3 (44.6% below EPA standard)
Grand Rapids, Michigan, is home to the West Michigan Clean Air Coalition, which declares a “Clean Air Action Day” when air pollutants reach a higher-than-normal level that could affect those with sensitivities. On a Clean Air Action Day, residents are asked to reduce their emissions by carpooling, taking public transportation, and delaying refueling or mowing lawns to improve the region’s air quality.
-
-
Earth Talk: What are the main contaminants we have to worry about in our drinking water?Kevin Ruck // Shutterstock
- Average coarse particulate matter (PM10): 13 μg/m^3
- Second-highest average coarse particulate matter (PM10): 31 μg/m^3 (383.9% below EPA standard)
- Average fine particulate matter (PM2.5): 8.2 μg/m^3 (46.3% below EPA standard)
South Carolina’s Greenville County has been improving its air quality over the past few years, after earning a C rating from the American Lung Association in 2014. In 2019, it exceeded the EPA standards in all categories.
Kevin Ruck // Shutterstock- Average coarse particulate matter (PM10): 13 μg/m^3
- Second-highest average coarse particulate matter (PM10): 31 μg/m^3 (383.9% below EPA standard)
- Average fine particulate matter (PM2.5): 8.2 μg/m^3 (46.3% below EPA standard)
South Carolina’s Greenville County has been improving its air quality over the past few years, after earning a C rating from the American Lung Association in 2014. In 2019, it exceeded the EPA standards in all categories.
-
Earth Talk: What are the main contaminants we have to worry about in our drinking water?Real Window Creative// Shutterstock
- Average coarse particulate matter (PM10): 13 μg/m^3
- Second-highest average coarse particulate matter (PM10): 28 μg/m^3 (435.7% below EPA standard)
- Average fine particulate matter (PM2.5): 7.5 μg/m^3 (60.0% below EPA standard)
Lexington-Fayette, Kentucky, has been meeting all EPA air quality standards since 2013, after spending two years above the EPA’s 8-hour ozone level of 0.070 ppm. By 2019, the area had reduced ozone levels to 0.059 ppm, a 24% reduction.
Real Window Creative// Shutterstock- Average coarse particulate matter (PM10): 13 μg/m^3
- Second-highest average coarse particulate matter (PM10): 28 μg/m^3 (435.7% below EPA standard)
- Average fine particulate matter (PM2.5): 7.5 μg/m^3 (60.0% below EPA standard)
Lexington-Fayette, Kentucky, has been meeting all EPA air quality standards since 2013, after spending two years above the EPA’s 8-hour ozone level of 0.070 ppm. By 2019, the area had reduced ozone levels to 0.059 ppm, a 24% reduction.
-
-
Earth Talk: What are the main contaminants we have to worry about in our drinking water?TurneroundDesigns // Shutterstock
- Average coarse particulate matter (PM10): 13 μg/m^3
- Second-highest average coarse particulate matter (PM10): 29 μg/m^3 (417.2% below EPA standard)
- Average fine particulate matter (PM2.5): 5.9 μg/m^3 (103.4% below EPA standard)
When there aren’t wildfires adding smoke to Napa, California’s atmosphere, the air quality is fairly high—especially when compared to nearby cities like San Francisco and Oakland, California. The Bay Area didn’t meet the EPA’s eight-hour ozone standards of 0.070 ppm in 2019, while Napa remained relatively smog-free with just 0.06 ppm.
TurneroundDesigns // Shutterstock- Average coarse particulate matter (PM10): 13 μg/m^3
- Second-highest average coarse particulate matter (PM10): 29 μg/m^3 (417.2% below EPA standard)
- Average fine particulate matter (PM2.5): 5.9 μg/m^3 (103.4% below EPA standard)
When there aren’t wildfires adding smoke to Napa, California’s atmosphere, the air quality is fairly high—especially when compared to nearby cities like San Francisco and Oakland, California. The Bay Area didn’t meet the EPA’s eight-hour ozone standards of 0.070 ppm in 2019, while Napa remained relatively smog-free with just 0.06 ppm.
-
Earth Talk: What are the main contaminants we have to worry about in our drinking water?Michele Vacchiano // Shutterstock
- Average coarse particulate matter (PM10): 13 μg/m^3
- Second-highest average coarse particulate matter (PM10): 34 μg/m^3 (341.2% below EPA standard)
- Average fine particulate matter (PM2.5): 7.2 μg/m^3 (66.7% below EPA standard)
The city of Riverton, Wyoming, lies within the Wind River Indian Reservation, but is incorporated as a part of Wyoming. The border between the two is disputed, but the EPA declared the reservation a state in 2013, allowing the tribes access to services such as grants for air monitoring programs.
Michele Vacchiano // Shutterstock- Average coarse particulate matter (PM10): 13 μg/m^3
- Second-highest average coarse particulate matter (PM10): 34 μg/m^3 (341.2% below EPA standard)
- Average fine particulate matter (PM2.5): 7.2 μg/m^3 (66.7% below EPA standard)
The city of Riverton, Wyoming, lies within the Wind River Indian Reservation, but is incorporated as a part of Wyoming. The border between the two is disputed, but the EPA declared the reservation a state in 2013, allowing the tribes access to services such as grants for air monitoring programs.
-
-
Earth Talk: What are the main contaminants we have to worry about in our drinking water?Nyttend // Wikimedia Commons
- Average coarse particulate matter (PM10): 13 μg/m^3
- Second-highest average coarse particulate matter (PM10): 26 μg/m^3 (476.9% below EPA standard)
- Average fine particulate matter (PM2.5): Data not available
Though 2019 data suggest air pollution levels met EPA standards, citizen groups like Concerned Ohio River Residents keep a close watch on air pollution levels in the Salem, Ohio, area. In December 2020, they even installed an air monitor in a resident’s home after she reported concern about the effect of local oil and gas emissions on human health.
Nyttend // Wikimedia Commons- Average coarse particulate matter (PM10): 13 μg/m^3
- Second-highest average coarse particulate matter (PM10): 26 μg/m^3 (476.9% below EPA standard)
- Average fine particulate matter (PM2.5): Data not available
Though 2019 data suggest air pollution levels met EPA standards, citizen groups like Concerned Ohio River Residents keep a close watch on air pollution levels in the Salem, Ohio, area. In December 2020, they even installed an air monitor in a resident’s home after she reported concern about the effect of local oil and gas emissions on human health.
-
Earth Talk: What are the main contaminants we have to worry about in our drinking water?Kirk Fisher // Shutterstock
- Average coarse particulate matter (PM10): 13 μg/m^3
- Second-highest average coarse particulate matter (PM10): 40 μg/m^3 (275.0% below EPA standard)
- Average fine particulate matter (PM2.5): Data not available
Surrounded by national forests, it’s perhaps no surprise that Sandpoint, Idaho, makes the list. While the American Lung Association reports that other cities in Idaho have some of the worst air quality nationwide, Sandpoint has remained relatively clean.
Kirk Fisher // Shutterstock- Average coarse particulate matter (PM10): 13 μg/m^3
- Second-highest average coarse particulate matter (PM10): 40 μg/m^3 (275.0% below EPA standard)
- Average fine particulate matter (PM2.5): Data not available
Surrounded by national forests, it’s perhaps no surprise that Sandpoint, Idaho, makes the list. While the American Lung Association reports that other cities in Idaho have some of the worst air quality nationwide, Sandpoint has remained relatively clean.
-
-
Earth Talk: What are the main contaminants we have to worry about in our drinking water?Marina Ivanova // Shutterstock
- Average coarse particulate matter (PM10): 13 μg/m^3
- Second-highest average coarse particulate matter (PM10): 73 μg/m^3 (105.5% below EPA standard)
- Average fine particulate matter (PM2.5): 5.7 μg/m^3 (110.5% below EPA standard)
Just 40 miles from Napa, California, the city of Santa Rosa, California, is another wine country stop with relatively clear air. The area was hit hard by wildfire smoke last fall, though, inspiring the EPA to hold a contest: A $10,000 prize will go to whoever can design a way to filter 80% of the particulate matter in a room in an hour.
Marina Ivanova // Shutterstock- Average coarse particulate matter (PM10): 13 μg/m^3
- Second-highest average coarse particulate matter (PM10): 73 μg/m^3 (105.5% below EPA standard)
- Average fine particulate matter (PM2.5): 5.7 μg/m^3 (110.5% below EPA standard)
Just 40 miles from Napa, California, the city of Santa Rosa, California, is another wine country stop with relatively clear air. The area was hit hard by wildfire smoke last fall, though, inspiring the EPA to hold a contest: A $10,000 prize will go to whoever can design a way to filter 80% of the particulate matter in a room in an hour.
-
Earth Talk: What are the main contaminants we have to worry about in our drinking water?dlafleurr// Shutterstock
- Average coarse particulate matter (PM10): 13 μg/m^3
- Second-highest average coarse particulate matter (PM10): 32 μg/m^3 (368.8% below EPA standard)
- Average fine particulate matter (PM2.5): 3.9 μg/m^3 (207.7% below EPA standard)
Hawaii has some of the cleanest air in the country, even in its urban areas like Honolulu. In fact, the American Lung Association reported that Honolulu County hit a record low in 2019 for the annual average particle pollution.
dlafleurr// Shutterstock- Average coarse particulate matter (PM10): 13 μg/m^3
- Second-highest average coarse particulate matter (PM10): 32 μg/m^3 (368.8% below EPA standard)
- Average fine particulate matter (PM2.5): 3.9 μg/m^3 (207.7% below EPA standard)
Hawaii has some of the cleanest air in the country, even in its urban areas like Honolulu. In fact, the American Lung Association reported that Honolulu County hit a record low in 2019 for the annual average particle pollution.
-
-
Earth Talk: What are the main contaminants we have to worry about in our drinking water?Jay Yuan // Shutterstock
- Average coarse particulate matter (PM10): 13 μg/m^3
- Second-highest average coarse particulate matter (PM10): 37 μg/m^3 (305.4% below EPA standard)
- Average fine particulate matter (PM2.5): 8.2 μg/m^3 (46.3% below EPA standard)
Worcester, Massachusetts, earned a worse grade in 2019 from the American Lung Association than it did in 2018, due to an increase in the number of bad air days for ozone. Still, the area ranks fairly well overall, meeting or exceeding EPA standards in every category.
Jay Yuan // Shutterstock- Average coarse particulate matter (PM10): 13 μg/m^3
- Second-highest average coarse particulate matter (PM10): 37 μg/m^3 (305.4% below EPA standard)
- Average fine particulate matter (PM2.5): 8.2 μg/m^3 (46.3% below EPA standard)
Worcester, Massachusetts, earned a worse grade in 2019 from the American Lung Association than it did in 2018, due to an increase in the number of bad air days for ozone. Still, the area ranks fairly well overall, meeting or exceeding EPA standards in every category.
-
Earth Talk: What are the main contaminants we have to worry about in our drinking water?Sean Pavone // Shutterstock
- Average coarse particulate matter (PM10): 12 μg/m^3
- Second-highest average coarse particulate matter (PM10): 25 μg/m^3 (500.0% below EPA standard)
- Average fine particulate matter (PM2.5): 10.7 μg/m^3 (12.1% below EPA standard)
From 2015 to 2017, Augusta, Georgia, recorded zero high ozone pollution days and only a handful of elevated fine particle pollution days—thanks to heightened regulations at power plants and more fuel-efficient vehicles on the road. The air quality in the region is only expected to improve, as Georgia Power has requested to shut down two coal-fired power plants.
Sean Pavone // Shutterstock- Average coarse particulate matter (PM10): 12 μg/m^3
- Second-highest average coarse particulate matter (PM10): 25 μg/m^3 (500.0% below EPA standard)
- Average fine particulate matter (PM2.5): 10.7 μg/m^3 (12.1% below EPA standard)
From 2015 to 2017, Augusta, Georgia, recorded zero high ozone pollution days and only a handful of elevated fine particle pollution days—thanks to heightened regulations at power plants and more fuel-efficient vehicles on the road. The air quality in the region is only expected to improve, as Georgia Power has requested to shut down two coal-fired power plants.
-
-
Earth Talk: What are the main contaminants we have to worry about in our drinking water?Sean Pavone // Shutterstock
- Average coarse particulate matter (PM10): 12 μg/m^3
- Second-highest average coarse particulate matter (PM10): 27 μg/m^3 (455.6% below EPA standard)
- Average fine particulate matter (PM2.5): 7.9 μg/m^3 (51.9% below EPA standard)
Durham and Chapel Hill, North Carolina, both experienced lower rates of year-round particle pollution in 2018, but fared somewhat worse in terms of short-term particle pollution, possibly because of wildfire smoke drifting in from the western part of the state. Both cities also experienced more unhealthy ozone days in 2018 compared to 2017.
Sean Pavone // Shutterstock- Average coarse particulate matter (PM10): 12 μg/m^3
- Second-highest average coarse particulate matter (PM10): 27 μg/m^3 (455.6% below EPA standard)
- Average fine particulate matter (PM2.5): 7.9 μg/m^3 (51.9% below EPA standard)
Durham and Chapel Hill, North Carolina, both experienced lower rates of year-round particle pollution in 2018, but fared somewhat worse in terms of short-term particle pollution, possibly because of wildfire smoke drifting in from the western part of the state. Both cities also experienced more unhealthy ozone days in 2018 compared to 2017.
-
Earth Talk: What are the main contaminants we have to worry about in our drinking water?Jill Lang // Shutterstock
- Average coarse particulate matter (PM10): 12 μg/m^3
- Second-highest average coarse particulate matter (PM10): 32 μg/m^3 (368.8% below EPA standard)
- Average fine particulate matter (PM2.5): Data not available
Pennsylvania’s Erie County achieved its best-ever results for daily and yearly particle pollution as well as ozone pollution in 2017 and has been able to maintain those results since. In 2018, the locale had zero days of unhealthy air quality. The annual particle pollution measured in 2017 showed a modest decline from 2014 to 2016 data collected in Erie County.
Jill Lang // Shutterstock- Average coarse particulate matter (PM10): 12 μg/m^3
- Second-highest average coarse particulate matter (PM10): 32 μg/m^3 (368.8% below EPA standard)
- Average fine particulate matter (PM2.5): Data not available
Pennsylvania’s Erie County achieved its best-ever results for daily and yearly particle pollution as well as ozone pollution in 2017 and has been able to maintain those results since. In 2018, the locale had zero days of unhealthy air quality. The annual particle pollution measured in 2017 showed a modest decline from 2014 to 2016 data collected in Erie County.
-
-
Earth Talk: What are the main contaminants we have to worry about in our drinking water?Kristi Blokhin // Shutterstock
- Average coarse particulate matter (PM10): 12 μg/m^3
- Second-highest average coarse particulate matter (PM10): 34 μg/m^3 (341.2% below EPA standard)
- Average fine particulate matter (PM2.5): Data not available
As with many of the western states appearing on this list, places with normally high air quality can shift dramatically during an event like a wildfire. For Glenwood Springs, Colorado, air pollution levels are typically low. But last August during wildfire season, PM2.5 levels were 47 μg/m^3 higher than usual.
Kristi Blokhin // Shutterstock- Average coarse particulate matter (PM10): 12 μg/m^3
- Second-highest average coarse particulate matter (PM10): 34 μg/m^3 (341.2% below EPA standard)
- Average fine particulate matter (PM2.5): Data not available
As with many of the western states appearing on this list, places with normally high air quality can shift dramatically during an event like a wildfire. For Glenwood Springs, Colorado, air pollution levels are typically low. But last August during wildfire season, PM2.5 levels were 47 μg/m^3 higher than usual.
-
Earth Talk: What are the main contaminants we have to worry about in our drinking water?Lynn Yeh // Shutterstock
- Average coarse particulate matter (PM10): 12 μg/m^3
- Second-highest average coarse particulate matter (PM10): 40 μg/m^3 (275.0% below EPA standard)
- Average fine particulate matter (PM2.5): 3.3 μg/m^3 (263.6% below EPA standard)
Jackson, Wyoming, has taken several steps in recent years to monitor its air quality as separate from neighboring areas. Before 2011, air quality data for Jackson came from as far as Yellowstone and Pinedale, Wyoming. But in 2011, Grand Teton National Park installed an air quality monitoring station to collect data and provide information about levels of ozone, sulfur dioxide, fine particles, and other pollutants.
Lynn Yeh // Shutterstock- Average coarse particulate matter (PM10): 12 μg/m^3
- Second-highest average coarse particulate matter (PM10): 40 μg/m^3 (275.0% below EPA standard)
- Average fine particulate matter (PM2.5): 3.3 μg/m^3 (263.6% below EPA standard)
Jackson, Wyoming, has taken several steps in recent years to monitor its air quality as separate from neighboring areas. Before 2011, air quality data for Jackson came from as far as Yellowstone and Pinedale, Wyoming. But in 2011, Grand Teton National Park installed an air quality monitoring station to collect data and provide information about levels of ozone, sulfur dioxide, fine particles, and other pollutants.
-
-
Earth Talk: What are the main contaminants we have to worry about in our drinking water?Songquan Deng // Shutterstock
- Average coarse particulate matter (PM10): 12 μg/m^3
- Second-highest average coarse particulate matter (PM10): 47 μg/m^3 (219.1% below EPA standard)
- Average fine particulate matter (PM2.5): 6.9 μg/m^3 (73.9% below EPA standard)
So-called bad air days are fairly rare in Central Florida, the worst of which are linked to commuter traffic on weekdays. In fact, the air is normally so clear that when a drought hit the area in May of 2017, the spurt of worsened air quality made the news.
Songquan Deng // Shutterstock- Average coarse particulate matter (PM10): 12 μg/m^3
- Second-highest average coarse particulate matter (PM10): 47 μg/m^3 (219.1% below EPA standard)
- Average fine particulate matter (PM2.5): 6.9 μg/m^3 (73.9% below EPA standard)
So-called bad air days are fairly rare in Central Florida, the worst of which are linked to commuter traffic on weekdays. In fact, the air is normally so clear that when a drought hit the area in May of 2017, the spurt of worsened air quality made the news.
-
Earth Talk: What are the main contaminants we have to worry about in our drinking water?MH Anderson Photography // Shutterstock
- Average coarse particulate matter (PM10): 12 μg/m^3
- Second-highest average coarse particulate matter (PM10): 34 μg/m^3 (341.2% below EPA standard)
- Average fine particulate matter (PM2.5): 7.5 μg/m^3 (60.0% below EPA standard)
Vermont typically has high air quality statewide, and Rutland, Vermont, is one of the best. In the American Lung Association’s 2020 report, the city earned an A rating—up from the previous year’s C.
MH Anderson Photography // Shutterstock- Average coarse particulate matter (PM10): 12 μg/m^3
- Second-highest average coarse particulate matter (PM10): 34 μg/m^3 (341.2% below EPA standard)
- Average fine particulate matter (PM2.5): 7.5 μg/m^3 (60.0% below EPA standard)
Vermont typically has high air quality statewide, and Rutland, Vermont, is one of the best. In the American Lung Association’s 2020 report, the city earned an A rating—up from the previous year’s C.
-
-
Earth Talk: What are the main contaminants we have to worry about in our drinking water?Jon Bilous // Shutterstock
- Average coarse particulate matter (PM10): 12 μg/m^3
- Second-highest average coarse particulate matter (PM10): 26 μg/m^3 (476.9% below EPA standard)
- Average fine particulate matter (PM2.5): Data not available
The Scranton-Wilkes-Barre metro area in Pennsylvania has improved even more since the 2019 EPA report, according to the American Lung Association. The area had its best air quality in recent years in 2020, for both fine and coarse particulate matter, as well as ozone.
Jon Bilous // Shutterstock- Average coarse particulate matter (PM10): 12 μg/m^3
- Second-highest average coarse particulate matter (PM10): 26 μg/m^3 (476.9% below EPA standard)
- Average fine particulate matter (PM2.5): Data not available
The Scranton-Wilkes-Barre metro area in Pennsylvania has improved even more since the 2019 EPA report, according to the American Lung Association. The area had its best air quality in recent years in 2020, for both fine and coarse particulate matter, as well as ozone.
-
Earth Talk: What are the main contaminants we have to worry about in our drinking water?Jacob Boomsma // Shutterstock
- Average coarse particulate matter (PM10): 12 μg/m^3
- Second-highest average coarse particulate matter (PM10): 37 μg/m^3 (305.4% below EPA standard)
- Average fine particulate matter (PM2.5): 6.9 μg/m^3 (73.9% below EPA standard)
Despite many power plants in South Dakota still burning coal, the state has been applauded for its clean air, and Sioux Falls, South Dakota, is notable in particular for its minimal levels of ozone pollution. One reason for South Dakota's pristine air quality is its use of wind energy, placing #2 in the country in its production of net electricity generated by wind. Power plants within the state have also moved toward using alternative fuel instead of nonrenewable resources.
Jacob Boomsma // Shutterstock- Average coarse particulate matter (PM10): 12 μg/m^3
- Second-highest average coarse particulate matter (PM10): 37 μg/m^3 (305.4% below EPA standard)
- Average fine particulate matter (PM2.5): 6.9 μg/m^3 (73.9% below EPA standard)
Despite many power plants in South Dakota still burning coal, the state has been applauded for its clean air, and Sioux Falls, South Dakota, is notable in particular for its minimal levels of ozone pollution. One reason for South Dakota's pristine air quality is its use of wind energy, placing #2 in the country in its production of net electricity generated by wind. Power plants within the state have also moved toward using alternative fuel instead of nonrenewable resources.
-
-
Earth Talk: What are the main contaminants we have to worry about in our drinking water?Ted PAGEL // Shutterstock
- Average coarse particulate matter (PM10): 12 μg/m^3
- Second-highest average coarse particulate matter (PM10): 33 μg/m^3 (354.5% below EPA standard)
- Average fine particulate matter (PM2.5): Data not available
Sandwiched just 150-300 miles from four other major metropolises—Kansas City, Missouri; St. Louis; Memphis, Tennessee; and Tulsa, Oklahoma—none of whom made this clean-air list, Springfield sits in a pocket of clean Missouri air. It can get a little smoggy, with 0.06 ppm of ozone in 2019, compared to the EPA’s standard of 0.07, but otherwise is an easy-breather.
Ted PAGEL // Shutterstock- Average coarse particulate matter (PM10): 12 μg/m^3
- Second-highest average coarse particulate matter (PM10): 33 μg/m^3 (354.5% below EPA standard)
- Average fine particulate matter (PM2.5): Data not available
Sandwiched just 150-300 miles from four other major metropolises—Kansas City, Missouri; St. Louis; Memphis, Tennessee; and Tulsa, Oklahoma—none of whom made this clean-air list, Springfield sits in a pocket of clean Missouri air. It can get a little smoggy, with 0.06 ppm of ozone in 2019, compared to the EPA’s standard of 0.07, but otherwise is an easy-breather.
-
Earth Talk: What are the main contaminants we have to worry about in our drinking water?AJ9 // Shutterstock
- Average coarse particulate matter (PM10): 12 μg/m^3
- Second-highest average coarse particulate matter (PM10): 38 μg/m^3 (294.7% below EPA standard)
- Average fine particulate matter (PM2.5): 6 μg/m^3 (100.0% below EPA standard)
While the air quality in Ukiah, California, is normally cleaner than most cities in the country, the devastating Camp Fire in 2018 sent the Air Quality Index in the region soaring to unhealthy levels, bringing an unusual amount of pollution to the area. Scientists determined that during the peak of the wildfire, breathing the air in Ukiah for just one day was the equivalent of smoking 13 and a half cigarettes.
AJ9 // Shutterstock- Average coarse particulate matter (PM10): 12 μg/m^3
- Second-highest average coarse particulate matter (PM10): 38 μg/m^3 (294.7% below EPA standard)
- Average fine particulate matter (PM2.5): 6 μg/m^3 (100.0% below EPA standard)
While the air quality in Ukiah, California, is normally cleaner than most cities in the country, the devastating Camp Fire in 2018 sent the Air Quality Index in the region soaring to unhealthy levels, bringing an unusual amount of pollution to the area. Scientists determined that during the peak of the wildfire, breathing the air in Ukiah for just one day was the equivalent of smoking 13 and a half cigarettes.
-
-
Earth Talk: What are the main contaminants we have to worry about in our drinking water?Wangkun Jia // Shutterstock
- Average coarse particulate matter (PM10): 11 μg/m^3
- Second-highest average coarse particulate matter (PM10): 43 μg/m^3 (248.8% below EPA standard)
- Average fine particulate matter (PM2.5): 4.4 μg/m^3 (172.7% below EPA standard)
Bangor, Maine, was ranked as one of the cleanest cities in 2019 in terms of the country’s most widespread air pollutants and was deemed one of only six cities nationwide as a “Cleanest City” in an American Lung Association report. But the rest of Maine fared worse, with the report finding that four other counties in Maine are experiencing more bad ozone days compared to the previous year.
Wangkun Jia // Shutterstock- Average coarse particulate matter (PM10): 11 μg/m^3
- Second-highest average coarse particulate matter (PM10): 43 μg/m^3 (248.8% below EPA standard)
- Average fine particulate matter (PM2.5): 4.4 μg/m^3 (172.7% below EPA standard)
Bangor, Maine, was ranked as one of the cleanest cities in 2019 in terms of the country’s most widespread air pollutants and was deemed one of only six cities nationwide as a “Cleanest City” in an American Lung Association report. But the rest of Maine fared worse, with the report finding that four other counties in Maine are experiencing more bad ozone days compared to the previous year.
-
Earth Talk: What are the main contaminants we have to worry about in our drinking water?Jacob Boomsma // Shutterstock
- Average coarse particulate matter (PM10): 11 μg/m^3
- Second-highest average coarse particulate matter (PM10): 22 μg/m^3 (581.8% below EPA standard)
- Average fine particulate matter (PM2.5): 3.5 μg/m^3 (242.9% below EPA standard)
The state of Wyoming has been working to reduce its air pollution, and efforts have been paying off. In the American Lung Association’s 2020 report, Casper, Wyoming, was one of just five cities that had zero unhealthy air days.
Jacob Boomsma // Shutterstock- Average coarse particulate matter (PM10): 11 μg/m^3
- Second-highest average coarse particulate matter (PM10): 22 μg/m^3 (581.8% below EPA standard)
- Average fine particulate matter (PM2.5): 3.5 μg/m^3 (242.9% below EPA standard)
The state of Wyoming has been working to reduce its air pollution, and efforts have been paying off. In the American Lung Association’s 2020 report, Casper, Wyoming, was one of just five cities that had zero unhealthy air days.
-
-
Earth Talk: What are the main contaminants we have to worry about in our drinking water?Jennifer Yakey-Ault // Shutterstock
- Average coarse particulate matter (PM10): 11 μg/m^3
- Second-highest average coarse particulate matter (PM10): 37 μg/m^3 (305.4% below EPA standard)
- Average fine particulate matter (PM2.5): 5.2 μg/m^3 (130.8% below EPA standard)
Coarse particulate matter pollution was down in 2019 in the Lewiston-Auburn, Maine, area from 12 μg/m^3 in the previous year and a recent high of 15 μg/m^3 in 2015.
Jennifer Yakey-Ault // Shutterstock- Average coarse particulate matter (PM10): 11 μg/m^3
- Second-highest average coarse particulate matter (PM10): 37 μg/m^3 (305.4% below EPA standard)
- Average fine particulate matter (PM2.5): 5.2 μg/m^3 (130.8% below EPA standard)
Coarse particulate matter pollution was down in 2019 in the Lewiston-Auburn, Maine, area from 12 μg/m^3 in the previous year and a recent high of 15 μg/m^3 in 2015.
-
Earth Talk: What are the main contaminants we have to worry about in our drinking water?Jacob A. Gallagher // Shutterstock
- Average coarse particulate matter (PM10): 11 μg/m^3
- Second-highest average coarse particulate matter (PM10): 30 μg/m^3 (400.0% below EPA standard)
- Average fine particulate matter (PM2.5): 6.5 μg/m^3 (84.6% below EPA standard)
Norwich-New London, Connecticut, could continue to rise on the list if a new proposal goes through to expand passenger trains in the area, potentially reducing emissions by improving public transit.
Jacob A. Gallagher // Shutterstock- Average coarse particulate matter (PM10): 11 μg/m^3
- Second-highest average coarse particulate matter (PM10): 30 μg/m^3 (400.0% below EPA standard)
- Average fine particulate matter (PM2.5): 6.5 μg/m^3 (84.6% below EPA standard)
Norwich-New London, Connecticut, could continue to rise on the list if a new proposal goes through to expand passenger trains in the area, potentially reducing emissions by improving public transit.
-
-
Earth Talk: What are the main contaminants we have to worry about in our drinking water?Jess Kraft // Shutterstock
- Average coarse particulate matter (PM10): 11 μg/m^3
- Second-highest average coarse particulate matter (PM10): 29 μg/m^3 (417.2% below EPA standard)
- Average fine particulate matter (PM2.5): 7 μg/m^3 (71.4% below EPA standard)
Although the Portland, Oregon, area has great air quality during some parts of the year, during last year’s wildfire season, it had some of the worst. In September 2020, the air quality was so poor that schools and services like trash pickups were cancelled in some areas.
Jess Kraft // Shutterstock- Average coarse particulate matter (PM10): 11 μg/m^3
- Second-highest average coarse particulate matter (PM10): 29 μg/m^3 (417.2% below EPA standard)
- Average fine particulate matter (PM2.5): 7 μg/m^3 (71.4% below EPA standard)
Although the Portland, Oregon, area has great air quality during some parts of the year, during last year’s wildfire season, it had some of the worst. In September 2020, the air quality was so poor that schools and services like trash pickups were cancelled in some areas.
-
Earth Talk: What are the main contaminants we have to worry about in our drinking water?ESB Professional // Shutterstock
- Average coarse particulate matter (PM10): 11 μg/m^3
- Second-highest average coarse particulate matter (PM10): 27 μg/m^3 (455.6% below EPA standard)
- Average fine particulate matter (PM2.5): 7.8 μg/m^3 (53.8% below EPA standard)
Reductions of coal-powered plants and vehicles running on cleaner energy have contributed to the rise in air quality in Richmond, Virginia. The city measured low amounts of daily fine particles in the air in 2016 and also cut down on year-round fine air particulate pollution. Smog has also waned in the metropolitan Richmond area, but the city still has work to do curbing unhealthy levels of ozone.
ESB Professional // Shutterstock- Average coarse particulate matter (PM10): 11 μg/m^3
- Second-highest average coarse particulate matter (PM10): 27 μg/m^3 (455.6% below EPA standard)
- Average fine particulate matter (PM2.5): 7.8 μg/m^3 (53.8% below EPA standard)
Reductions of coal-powered plants and vehicles running on cleaner energy have contributed to the rise in air quality in Richmond, Virginia. The city measured low amounts of daily fine particles in the air in 2016 and also cut down on year-round fine air particulate pollution. Smog has also waned in the metropolitan Richmond area, but the city still has work to do curbing unhealthy levels of ozone.
-
-
Earth Talk: What are the main contaminants we have to worry about in our drinking water?Alexandr Junek Imaging // Shutterstock
- Average coarse particulate matter (PM10): 11 μg/m^3
- Second-highest average coarse particulate matter (PM10): 20 μg/m^3 (650.0% below EPA standard)
- Average fine particulate matter (PM2.5): 7.1 μg/m^3 (69.0% below EPA standard)
In 2018, the Virginia Beach and Norfolk, Virginia, area landed on the American Lung Association’s list of cleanest U.S. cities in terms of daily fine particle pollution for the third year in a row. The air quality in the region even improved compared to previous years. It also marked the eighth year that the locale met national standards for air pollution, even though the Virginia Beach area still sometimes struggles with ozone pollution levels.
Alexandr Junek Imaging // Shutterstock- Average coarse particulate matter (PM10): 11 μg/m^3
- Second-highest average coarse particulate matter (PM10): 20 μg/m^3 (650.0% below EPA standard)
- Average fine particulate matter (PM2.5): 7.1 μg/m^3 (69.0% below EPA standard)
In 2018, the Virginia Beach and Norfolk, Virginia, area landed on the American Lung Association’s list of cleanest U.S. cities in terms of daily fine particle pollution for the third year in a row. The air quality in the region even improved compared to previous years. It also marked the eighth year that the locale met national standards for air pollution, even though the Virginia Beach area still sometimes struggles with ozone pollution levels.
-
Earth Talk: What are the main contaminants we have to worry about in our drinking water?GagliardiPhotography // Shutterstock
- Average coarse particulate matter (PM10): 10 μg/m^3
- Second-highest average coarse particulate matter (PM10): 22 μg/m^3 (581.8% below EPA standard)
- Average fine particulate matter (PM2.5): 8.1 μg/m^3 (48.1% below EPA standard)
In 2018, the Boston area recorded some of its lowest pollution levels on record, improving in both measures of particle pollution and ozone pollution. Counties in the greater Boston area, including Bristol, Essex, and Suffolk, also cut pollution levels, and only one county in all of Massachusetts saw an increase in ozone levels. The state’s improvement in air quality was in contrast to a national trend that saw an average rise in ozone levels nationwide.
GagliardiPhotography // Shutterstock- Average coarse particulate matter (PM10): 10 μg/m^3
- Second-highest average coarse particulate matter (PM10): 22 μg/m^3 (581.8% below EPA standard)
- Average fine particulate matter (PM2.5): 8.1 μg/m^3 (48.1% below EPA standard)
In 2018, the Boston area recorded some of its lowest pollution levels on record, improving in both measures of particle pollution and ozone pollution. Counties in the greater Boston area, including Bristol, Essex, and Suffolk, also cut pollution levels, and only one county in all of Massachusetts saw an increase in ozone levels. The state’s improvement in air quality was in contrast to a national trend that saw an average rise in ozone levels nationwide.
-
-
Earth Talk: What are the main contaminants we have to worry about in our drinking water?Eden Vieira // Shutterstock
- Average coarse particulate matter (PM10): 10 μg/m^3
- Second-highest average coarse particulate matter (PM10): 21 μg/m^3 (614.3% below EPA standard)
- Average fine particulate matter (PM2.5): 3.1 μg/m^3 (287.1% below EPA standard)
Lake County, which is home to the city of Clearlake, California, has been rated as one of the top places in the country for its lack of fine particle pollution, but has exceeded federal ozone standards due to wildfires. The county had bested all other locales in California in air quality for at least 24 years, but fell out of the top 25 in 2020 as a result of the wildfires that have ravaged the state in the past several years.
Eden Vieira // Shutterstock- Average coarse particulate matter (PM10): 10 μg/m^3
- Second-highest average coarse particulate matter (PM10): 21 μg/m^3 (614.3% below EPA standard)
- Average fine particulate matter (PM2.5): 3.1 μg/m^3 (287.1% below EPA standard)
Lake County, which is home to the city of Clearlake, California, has been rated as one of the top places in the country for its lack of fine particle pollution, but has exceeded federal ozone standards due to wildfires. The county had bested all other locales in California in air quality for at least 24 years, but fell out of the top 25 in 2020 as a result of the wildfires that have ravaged the state in the past several years.
-
Earth Talk: What are the main contaminants we have to worry about in our drinking water?Sherman Cahal // Shutterstock
- Average coarse particulate matter (PM10): 10 μg/m^3
- Second-highest average coarse particulate matter (PM10): 20 μg/m^3 (650.0% below EPA standard)
- Average fine particulate matter (PM2.5): 6.7 μg/m^3 (79.1% below EPA standard)
The Rust Belt isn’t exactly known for its air quality, but Portsmouth, Ohio, ranked in the top 10 for air quality according to the EPA’s 2019 data. Its stats are even down from the previous year for all three particulate matter categories.
Sherman Cahal // Shutterstock- Average coarse particulate matter (PM10): 10 μg/m^3
- Second-highest average coarse particulate matter (PM10): 20 μg/m^3 (650.0% below EPA standard)
- Average fine particulate matter (PM2.5): 6.7 μg/m^3 (79.1% below EPA standard)
The Rust Belt isn’t exactly known for its air quality, but Portsmouth, Ohio, ranked in the top 10 for air quality according to the EPA’s 2019 data. Its stats are even down from the previous year for all three particulate matter categories.
-
-
Earth Talk: What are the main contaminants we have to worry about in our drinking water?Paul Brady Photography // Shutterstock
- Average coarse particulate matter (PM10): 10 μg/m^3
- Second-highest average coarse particulate matter (PM10): 24 μg/m^3 (525.0% below EPA standard)
- Average fine particulate matter (PM2.5): 6.6 μg/m^3 (81.8% below EPA standard)
Rochester, New York, has worked to reduce air pollutants from the stacks of coal-burning power plants and other stationary sources and has put more cars with cleaner tailpipe emissions on the road, which have contributed significantly to improvements in air quality. From 2001 to 2003, Rochester experienced about 18.5 days per year with elevated ozone levels, while between 2013 to 2015, the city had just one day with higher-than-normal ozone pollution.
Paul Brady Photography // Shutterstock- Average coarse particulate matter (PM10): 10 μg/m^3
- Second-highest average coarse particulate matter (PM10): 24 μg/m^3 (525.0% below EPA standard)
- Average fine particulate matter (PM2.5): 6.6 μg/m^3 (81.8% below EPA standard)
Rochester, New York, has worked to reduce air pollutants from the stacks of coal-burning power plants and other stationary sources and has put more cars with cleaner tailpipe emissions on the road, which have contributed significantly to improvements in air quality. From 2001 to 2003, Rochester experienced about 18.5 days per year with elevated ozone levels, while between 2013 to 2015, the city had just one day with higher-than-normal ozone pollution.
-
Earth Talk: What are the main contaminants we have to worry about in our drinking water?emperorcosar // Shutterstock
- Average coarse particulate matter (PM10): 10 μg/m^3
- Second-highest average coarse particulate matter (PM10): 22 μg/m^3 (581.8% below EPA standard)
- Average fine particulate matter (PM2.5): 8.8 μg/m^3 (36.4% below EPA standard)
Like its neighbor, Portland, Oregon, the city of Seattle can have some of the worst air quality when wildfire smoke is in the air. But otherwise, it’s fairly clear and getting clearer: In January, the EPA reported that chemicals released into the environment in Washington were down 16%, or 5.1 million pounds, in 2019.
emperorcosar // Shutterstock- Average coarse particulate matter (PM10): 10 μg/m^3
- Second-highest average coarse particulate matter (PM10): 22 μg/m^3 (581.8% below EPA standard)
- Average fine particulate matter (PM2.5): 8.8 μg/m^3 (36.4% below EPA standard)
Like its neighbor, Portland, Oregon, the city of Seattle can have some of the worst air quality when wildfire smoke is in the air. But otherwise, it’s fairly clear and getting clearer: In January, the EPA reported that chemicals released into the environment in Washington were down 16%, or 5.1 million pounds, in 2019.
-
-
Earth Talk: What are the main contaminants we have to worry about in our drinking water?Jon Bilous // Shutterstock
- Average coarse particulate matter (PM10): 10 μg/m^3
- Second-highest average coarse particulate matter (PM10): 25 μg/m^3 (500.0% below EPA standard)
- Average fine particulate matter (PM2.5): 7.6 μg/m^3 (57.9% below EPA standard)
While Winchester, Virginia, has had pristine air quality, residents were concerned that the Trump administration’s Affordable Clean Energy Rule, which replaced an Obama administration plan, would dirty the air and disproportionately affect the Shenandoah Valley as opposed to the rest of the country. Under the new policy, there would be an increase of between 0.43 and 0.85 deaths per 100,000 residents in the Shenandoah Valley, according to the EPA. The current Biden administration, with a new EPA administrator, will work on regulations for automobiles, power plants, and mercury emissions.
Jon Bilous // Shutterstock- Average coarse particulate matter (PM10): 10 μg/m^3
- Second-highest average coarse particulate matter (PM10): 25 μg/m^3 (500.0% below EPA standard)
- Average fine particulate matter (PM2.5): 7.6 μg/m^3 (57.9% below EPA standard)
While Winchester, Virginia, has had pristine air quality, residents were concerned that the Trump administration’s Affordable Clean Energy Rule, which replaced an Obama administration plan, would dirty the air and disproportionately affect the Shenandoah Valley as opposed to the rest of the country. Under the new policy, there would be an increase of between 0.43 and 0.85 deaths per 100,000 residents in the Shenandoah Valley, according to the EPA. The current Biden administration, with a new EPA administrator, will work on regulations for automobiles, power plants, and mercury emissions.
-
Earth Talk: What are the main contaminants we have to worry about in our drinking water?emperorcosar // Shutterstock
- Average coarse particulate matter (PM10): 9 μg/m^3
- Second-highest average coarse particulate matter (PM10): 50 μg/m^3 (200.0% below EPA standard)
- Average fine particulate matter (PM2.5): 6.8 μg/m^3 (76.5% below EPA standard)
One of the biggest air pollution concerns in Juneau, Alaska, is emissions from cruise ships that love to dock on its shores each summer. Luckily, the air quality in the Alaskan town is still good, especially when compared to other cities nationwide.
emperorcosar // Shutterstock- Average coarse particulate matter (PM10): 9 μg/m^3
- Second-highest average coarse particulate matter (PM10): 50 μg/m^3 (200.0% below EPA standard)
- Average fine particulate matter (PM2.5): 6.8 μg/m^3 (76.5% below EPA standard)
One of the biggest air pollution concerns in Juneau, Alaska, is emissions from cruise ships that love to dock on its shores each summer. Luckily, the air quality in the Alaskan town is still good, especially when compared to other cities nationwide.
-
-
Earth Talk: What are the main contaminants we have to worry about in our drinking water?V-ron // Shutterstock
- Average coarse particulate matter (PM10): 8 μg/m^3
- Second-highest average coarse particulate matter (PM10): 22 μg/m^3 (581.8% below EPA standard)
- Average fine particulate matter (PM2.5): 7 μg/m^3 (71.4% below EPA standard)
A clean energy center outside Portage, Wisconsin—a neighboring town of Beaver Dam, Wisconsin—opened in 2018, and has cut nitrogen emissions in half by installing a selective catalytic reduction system in the boilers of a power plant. The technology removed nitrogen from the plant’s exhaust, improving air quality and reducing the effect on Wisconsinites’ respiratory health.
V-ron // Shutterstock- Average coarse particulate matter (PM10): 8 μg/m^3
- Second-highest average coarse particulate matter (PM10): 22 μg/m^3 (581.8% below EPA standard)
- Average fine particulate matter (PM2.5): 7 μg/m^3 (71.4% below EPA standard)
A clean energy center outside Portage, Wisconsin—a neighboring town of Beaver Dam, Wisconsin—opened in 2018, and has cut nitrogen emissions in half by installing a selective catalytic reduction system in the boilers of a power plant. The technology removed nitrogen from the plant’s exhaust, improving air quality and reducing the effect on Wisconsinites’ respiratory health.
-
Earth Talk: What are the main contaminants we have to worry about in our drinking water?Eric Strand // Shutterstock
- Average coarse particulate matter (PM10): 8 μg/m^3
- Second-highest average coarse particulate matter (PM10): 23 μg/m^3 (552.2% below EPA standard)
- Average fine particulate matter (PM2.5): Data not available
Farmington, New Mexico, has some of the cleanest air in the country in terms of particle pollution, tying with Cheyenne, Wyoming, for first place in 2017 for soot-free air, but earning less than satisfactory grades on ozone pollution. However, Farmington still has a long way to go when it comes to monitoring air quality. The city only has one air quality monitoring station, which only collects data every 12 days.
Eric Strand // Shutterstock- Average coarse particulate matter (PM10): 8 μg/m^3
- Second-highest average coarse particulate matter (PM10): 23 μg/m^3 (552.2% below EPA standard)
- Average fine particulate matter (PM2.5): Data not available
Farmington, New Mexico, has some of the cleanest air in the country in terms of particle pollution, tying with Cheyenne, Wyoming, for first place in 2017 for soot-free air, but earning less than satisfactory grades on ozone pollution. However, Farmington still has a long way to go when it comes to monitoring air quality. The city only has one air quality monitoring station, which only collects data every 12 days.
-
-
Earth Talk: What are the main contaminants we have to worry about in our drinking water?J. Stephen Conn // Flickr
- Average coarse particulate matter (PM10): 7 μg/m^3
- Second-highest average coarse particulate matter (PM10): 23 μg/m^3 (552.2% below EPA standard)
- Average fine particulate matter (PM2.5): Data not available
To combat EPA rolling back some federal pollution regulations, Wyoming state regulators proposed in 2018 to implement rules that would reduce methane emissions from infrastructure within the state and levy additional requirements in the Upper Green River Basin, which was once heavily polluted. The region had a spike in gas development when natural gas deposits were discovered, and its bowl-shaped geography exacerbated air pollution.
J. Stephen Conn // Flickr- Average coarse particulate matter (PM10): 7 μg/m^3
- Second-highest average coarse particulate matter (PM10): 23 μg/m^3 (552.2% below EPA standard)
- Average fine particulate matter (PM2.5): Data not available
To combat EPA rolling back some federal pollution regulations, Wyoming state regulators proposed in 2018 to implement rules that would reduce methane emissions from infrastructure within the state and levy additional requirements in the Upper Green River Basin, which was once heavily polluted. The region had a spike in gas development when natural gas deposits were discovered, and its bowl-shaped geography exacerbated air pollution.
-
Earth Talk: What are the main contaminants we have to worry about in our drinking water?Yosoyana // Shutterstock
- Average coarse particulate matter (PM10): 6 μg/m^3
- Second-highest average coarse particulate matter (PM10): 27 μg/m^3 (455.6% below EPA standard)
- Average fine particulate matter (PM2.5): 4.5 μg/m^3 (166.7% below EPA standard)
North Dakota’s windy weather and open spaces without obstruction from high elevation have long served the state’s air quality, resulting in a consistent “cleaning” of air pollutants from the state’s air. Still, some officials in North Dakota are worried that the presence of power plants and oil and gas emissions is still adversely affecting the state, despite stellar air quality reports. Currently, the state is seeking funding for an additional air quality monitoring station to better review pollution data.
Yosoyana // Shutterstock- Average coarse particulate matter (PM10): 6 μg/m^3
- Second-highest average coarse particulate matter (PM10): 27 μg/m^3 (455.6% below EPA standard)
- Average fine particulate matter (PM2.5): 4.5 μg/m^3 (166.7% below EPA standard)
North Dakota’s windy weather and open spaces without obstruction from high elevation have long served the state’s air quality, resulting in a consistent “cleaning” of air pollutants from the state’s air. Still, some officials in North Dakota are worried that the presence of power plants and oil and gas emissions is still adversely affecting the state, despite stellar air quality reports. Currently, the state is seeking funding for an additional air quality monitoring station to better review pollution data.
-
-
Earth Talk: What are the main contaminants we have to worry about in our drinking water?Karen Grigoryan // Shutterstock
- Average coarse particulate matter (PM10): 6 μg/m^3
- Second-highest average coarse particulate matter (PM10): 15 μg/m^3 (900.0% below EPA standard)
- Average fine particulate matter (PM2.5): 7.7 μg/m^3 (55.8% below EPA standard)
Springfield, Massachusetts, located 100 miles west of Boston, has some of the best air in the country. Part of this is due to local regulations, like anti-idling laws aimed at reducing extra air pollution.
Karen Grigoryan // Shutterstock- Average coarse particulate matter (PM10): 6 μg/m^3
- Second-highest average coarse particulate matter (PM10): 15 μg/m^3 (900.0% below EPA standard)
- Average fine particulate matter (PM2.5): 7.7 μg/m^3 (55.8% below EPA standard)
Springfield, Massachusetts, located 100 miles west of Boston, has some of the best air in the country. Part of this is due to local regulations, like anti-idling laws aimed at reducing extra air pollution.
-
Earth Talk: What are the main contaminants we have to worry about in our drinking water?Andrew Filer // Wikimedia Commons
- Average coarse particulate matter (PM10): 6 μg/m^3
- Second-highest average coarse particulate matter (PM10): 22 μg/m^3 (581.8% below EPA standard)
- Average fine particulate matter (PM2.5): 4.1 μg/m^3 (192.7% below EPA standard)
While Williston, North Dakota, annually received high marks for its clean air, wildfires in the western part of the United States brought smoky and hazy air into the city, and with it, particle pollution. However, Williams County, where Williston is located, had little to no ozone pollution in 2018. North Dakota’s clean air is primarily because of constant wind presence in the state, which ushers out dirty air and brings in clean air.
Andrew Filer // Wikimedia Commons- Average coarse particulate matter (PM10): 6 μg/m^3
- Second-highest average coarse particulate matter (PM10): 22 μg/m^3 (581.8% below EPA standard)
- Average fine particulate matter (PM2.5): 4.1 μg/m^3 (192.7% below EPA standard)
While Williston, North Dakota, annually received high marks for its clean air, wildfires in the western part of the United States brought smoky and hazy air into the city, and with it, particle pollution. However, Williams County, where Williston is located, had little to no ozone pollution in 2018. North Dakota’s clean air is primarily because of constant wind presence in the state, which ushers out dirty air and brings in clean air.
-
-
Earth Talk: What are the main contaminants we have to worry about in our drinking water?Erika J Mitchell // Shutterstock
- Average coarse particulate matter (PM10): 5 μg/m^3
- Second-highest average coarse particulate matter (PM10): 14 μg/m^3 (971.4% below EPA standard)
- Average fine particulate matter (PM2.5): 6.6 μg/m^3 (81.8% below EPA standard)
Year after year, Vermont is considered one of the cleanest places in the United States for air quality, but the Burlington, Vermont, area has consistently outshone other cities with its sparkling clean air. In 2019, Burlington was one of only six cities in the country to record zero days of unhealthy ozone levels as well as short-term pollution. Year-round particle pollution also decreased in 2019 compared to the previous year.
You may also like: 20 safety preparations for the weather this summer
Erika J Mitchell // Shutterstock- Average coarse particulate matter (PM10): 5 μg/m^3
- Second-highest average coarse particulate matter (PM10): 14 μg/m^3 (971.4% below EPA standard)
- Average fine particulate matter (PM2.5): 6.6 μg/m^3 (81.8% below EPA standard)
Year after year, Vermont is considered one of the cleanest places in the United States for air quality, but the Burlington, Vermont, area has consistently outshone other cities with its sparkling clean air. In 2019, Burlington was one of only six cities in the country to record zero days of unhealthy ozone levels as well as short-term pollution. Year-round particle pollution also decreased in 2019 compared to the previous year.
You may also like: 20 safety preparations for the weather this summer
How bad is E15 for air pollution and health?
Ground-level smog contains ozone, which is the main health concern. Breathing ozone is harmful for anyone but particularly bad for older folks, people with asthma or other respiratory illness and people who work strenuous outdoor jobs and face more exposure.
Becker told CNN that more ozone smog is especially bad for childhood asthma.
“That’s a bad health and environmental result,” Becker said. “It means the ethanol lobby will be happy and kids with asthma will be sicker.”
Here are some of the effects of breathing ozone, according to the EPA and the CDC:
- Coughing and scratchy throat
- Difficulty breathing deeply
- Inflamed, damaged airways
- Higher susceptibility to infections
- Makes things like asthma, bronchitis and emphysema worse
Has this been done before?
E15 was legal year-round until 2011, when the EPA moved to ban it in the summer.
Also, the Biden administration is replicating a Trump administration move to waive the E15 rule in 2019. The move by Trump’s EPA was later blocked by a panel of federal judges.
Biden officials stressed to reporters that this is responding to an emergency situation. Biden’s announcement, a senior administration official said, “is distinct from” his predecessor’s efforts to expand ethanol sales in that it’s “based on the current circumstance, which is a fuel supply emergency.”
___
Categories: Trending