
Volkswagen’s bus is finally back. And now it’s electric
Martin Meiners/Volkswagen
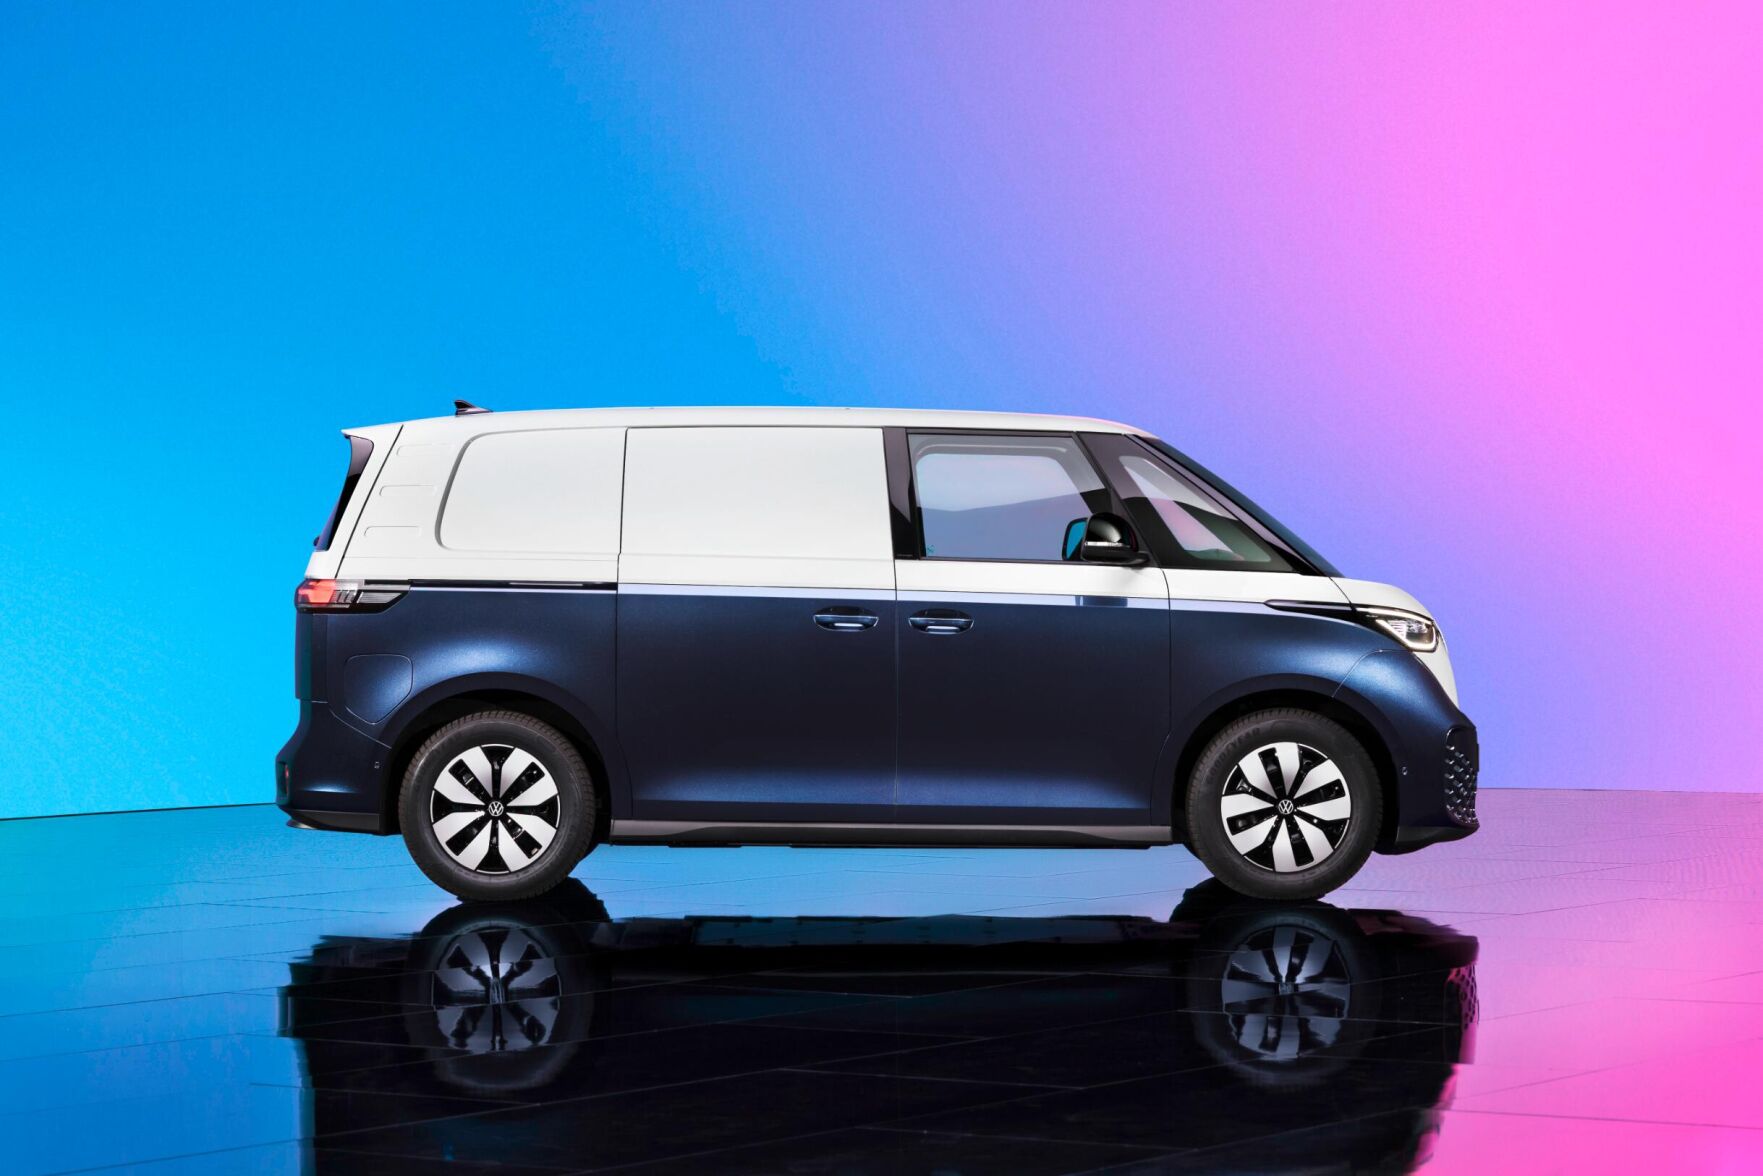
The ID. Buzz will also be available as a cargo van.
It’s been promised for years. Now it’s finally here. Volkswagen has unveiled the production version of the VW ID. Buzz, a 21st century version of the classic VW Bus. Unlike the noisy and underpowered original bus, the new version will be full electric with ample horsepower.
The Bus was a cultural icon on par with its smaller sister model, the VW Beetle. It was officially known as the Volkswagen T1 or Transporter but best known as the Microbus or, simply, the Bus. In America, it became associated with the Hippie movement, but the Bus also provided transportation for large families decades before the minivan was invented.
The classic Microbus has become a favorite among collectors. Nicely kept versions have sold for six-figure sums. The world’s most valuable Hot Wheels car, worth as much as $150,000, is a tiny Microbus.
Martin Meiners/Volkswagen
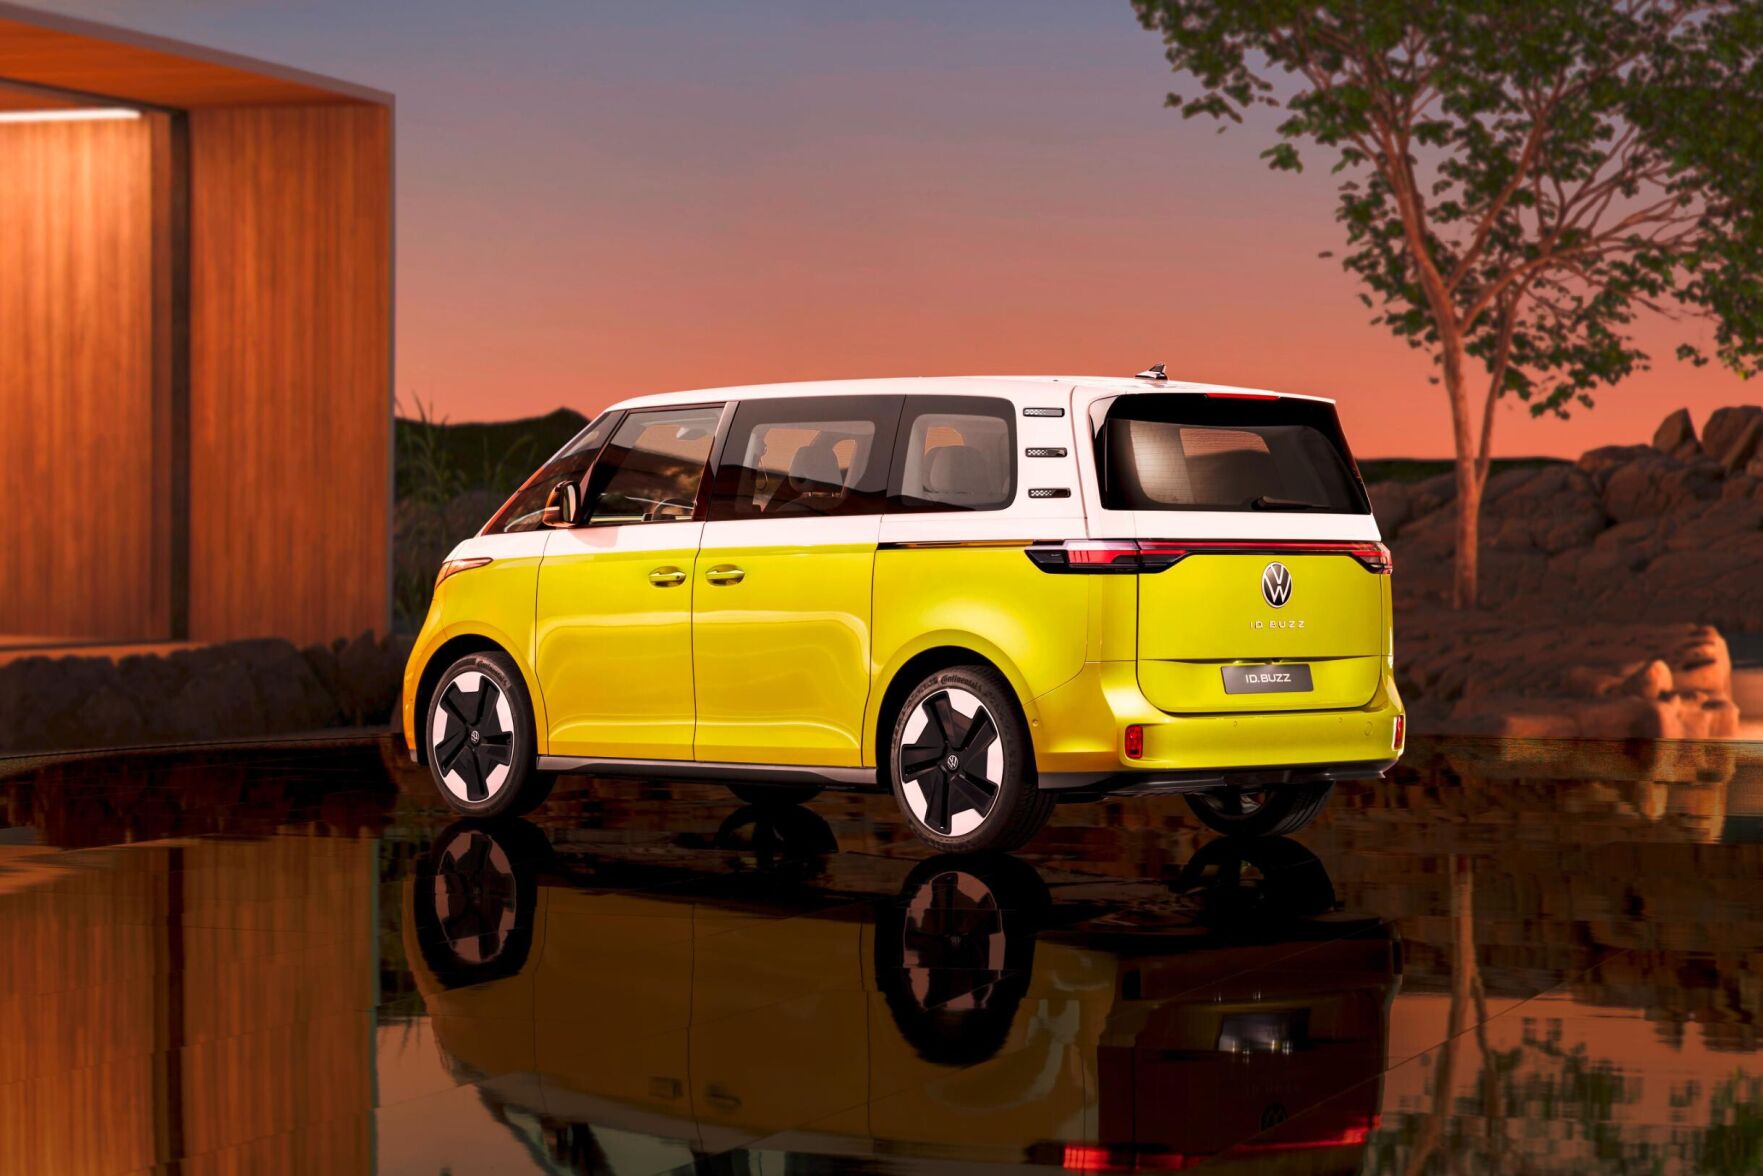
As on the original VW Bus the wheels are set far out to the ends.
While VW designers didn’t want to simply recreate the look of the original van, the automaker said, many elements of the ID. Buzz’s exterior are clearly inspired by it. The new van will be available with two-tone paint like the original. It also has short front and rear “overhangs,” the distance between the wheels and the ends of the body, like the original. Besides giving the van an overall shape similar to the Microbus, the short overhangs also allow for more space inside the van.
Like the Beetle, the Microbus had a small engine mounted in the back. The new VW ID. Buzz, likewise, has its electric motor in the back powering the van’s rear wheels. The motor in the ID. Buzz unveiled Wednesday will produce up to 201 horsepower, far more than the classic Bus’s meager two-digit horsepower figures. Different versions of the Buzz with various power capabilities will be announced later, VW said.
Andrew Trahan Photography/Volkswagen
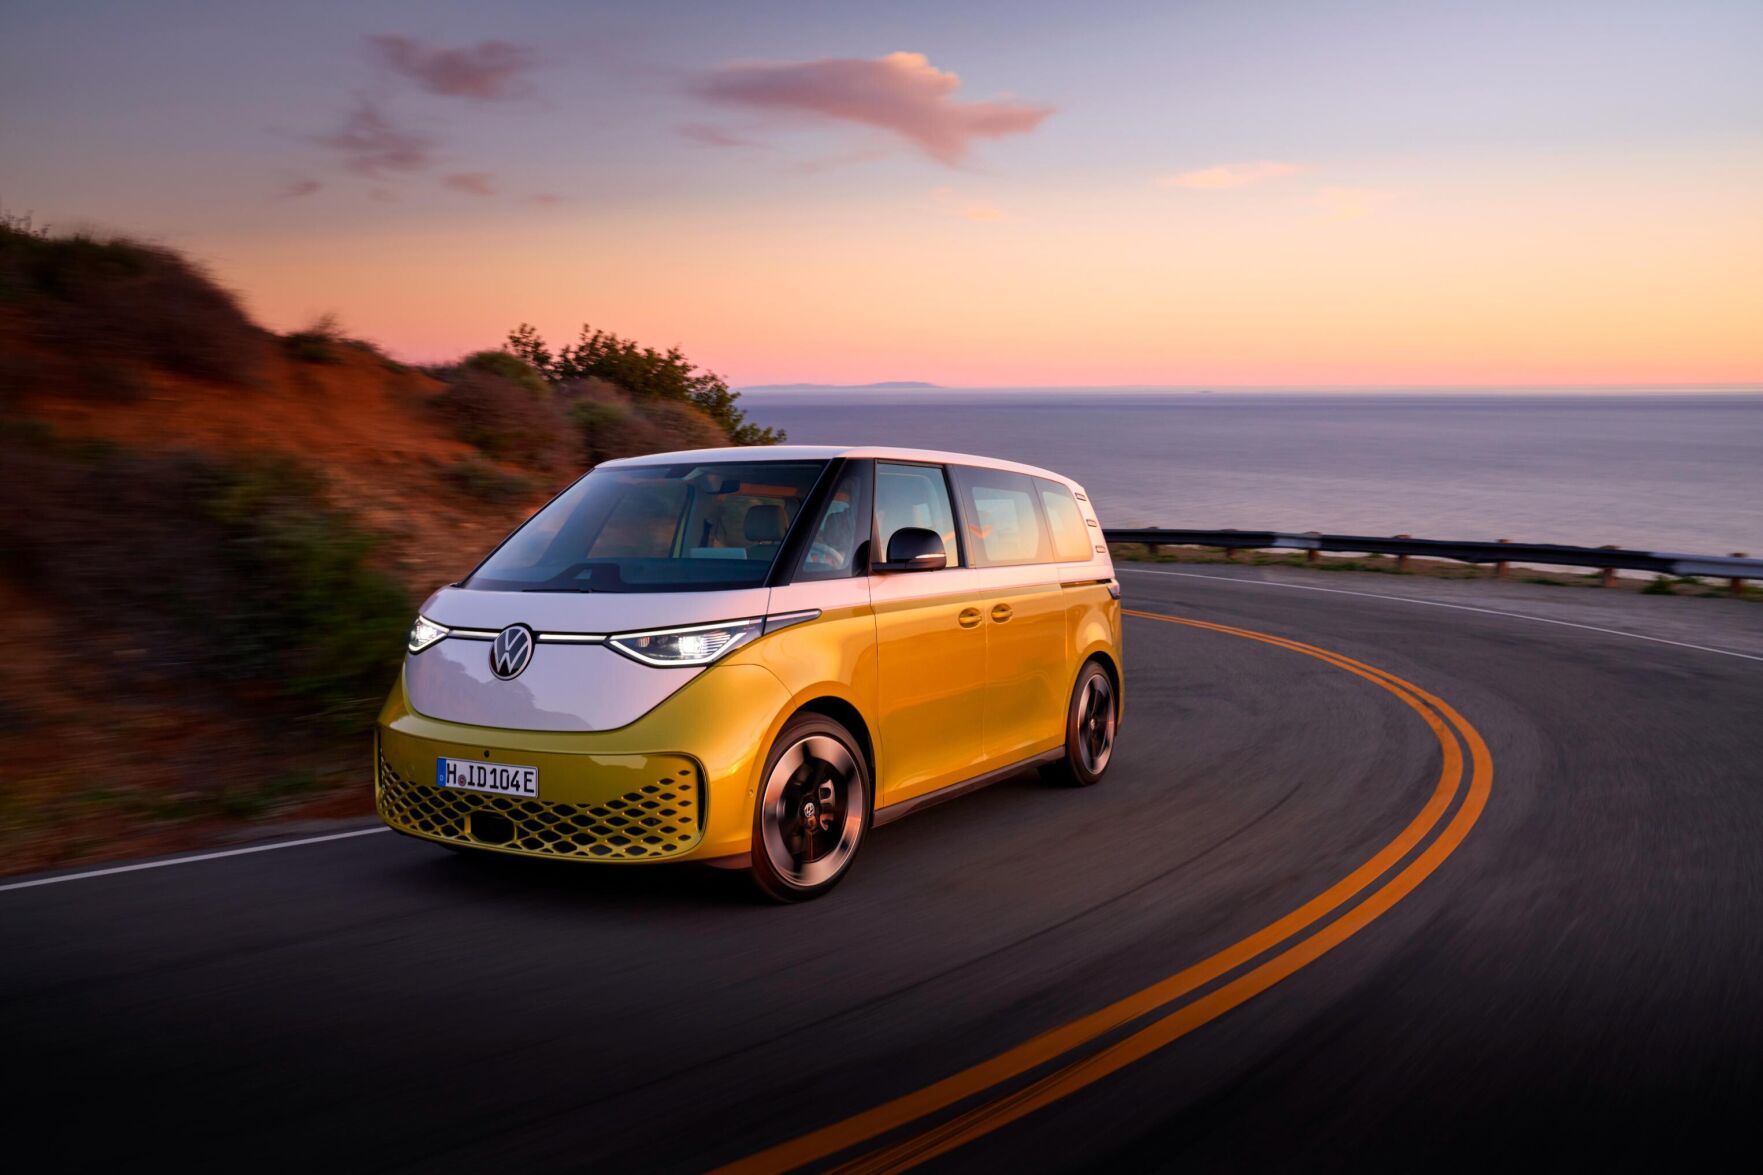
The Volkswagen ID. Buzz isn't a straight copy of the original but shares its personality.
The ID. Buzz’s battery packs are mounted under the floor. That gives the van a low center of gravity and, VW promises, particularly agile handling for a van. It shares much of its engineering with other new Volkswagen electric vehicles, such as the ID.4 crossover SUV.
Volkswagen Group, which owns the Volkswagen, Audi, Porsche and Bentley brands, among others, is pushing heavily into electric vehicles and expects 25% of its sales to be EVs by 2026. As of last year, they made up about 5% of VW Group’s global sales. Currently, in the US, VW Group sells the electric Audi E-Tron models and Porsche Taycan models in addition to the ID. 4. Overseas, VW Group brands Škoda and Opel also offer electric vehicles, and Bentley plans to sell only electric cars by 2030.
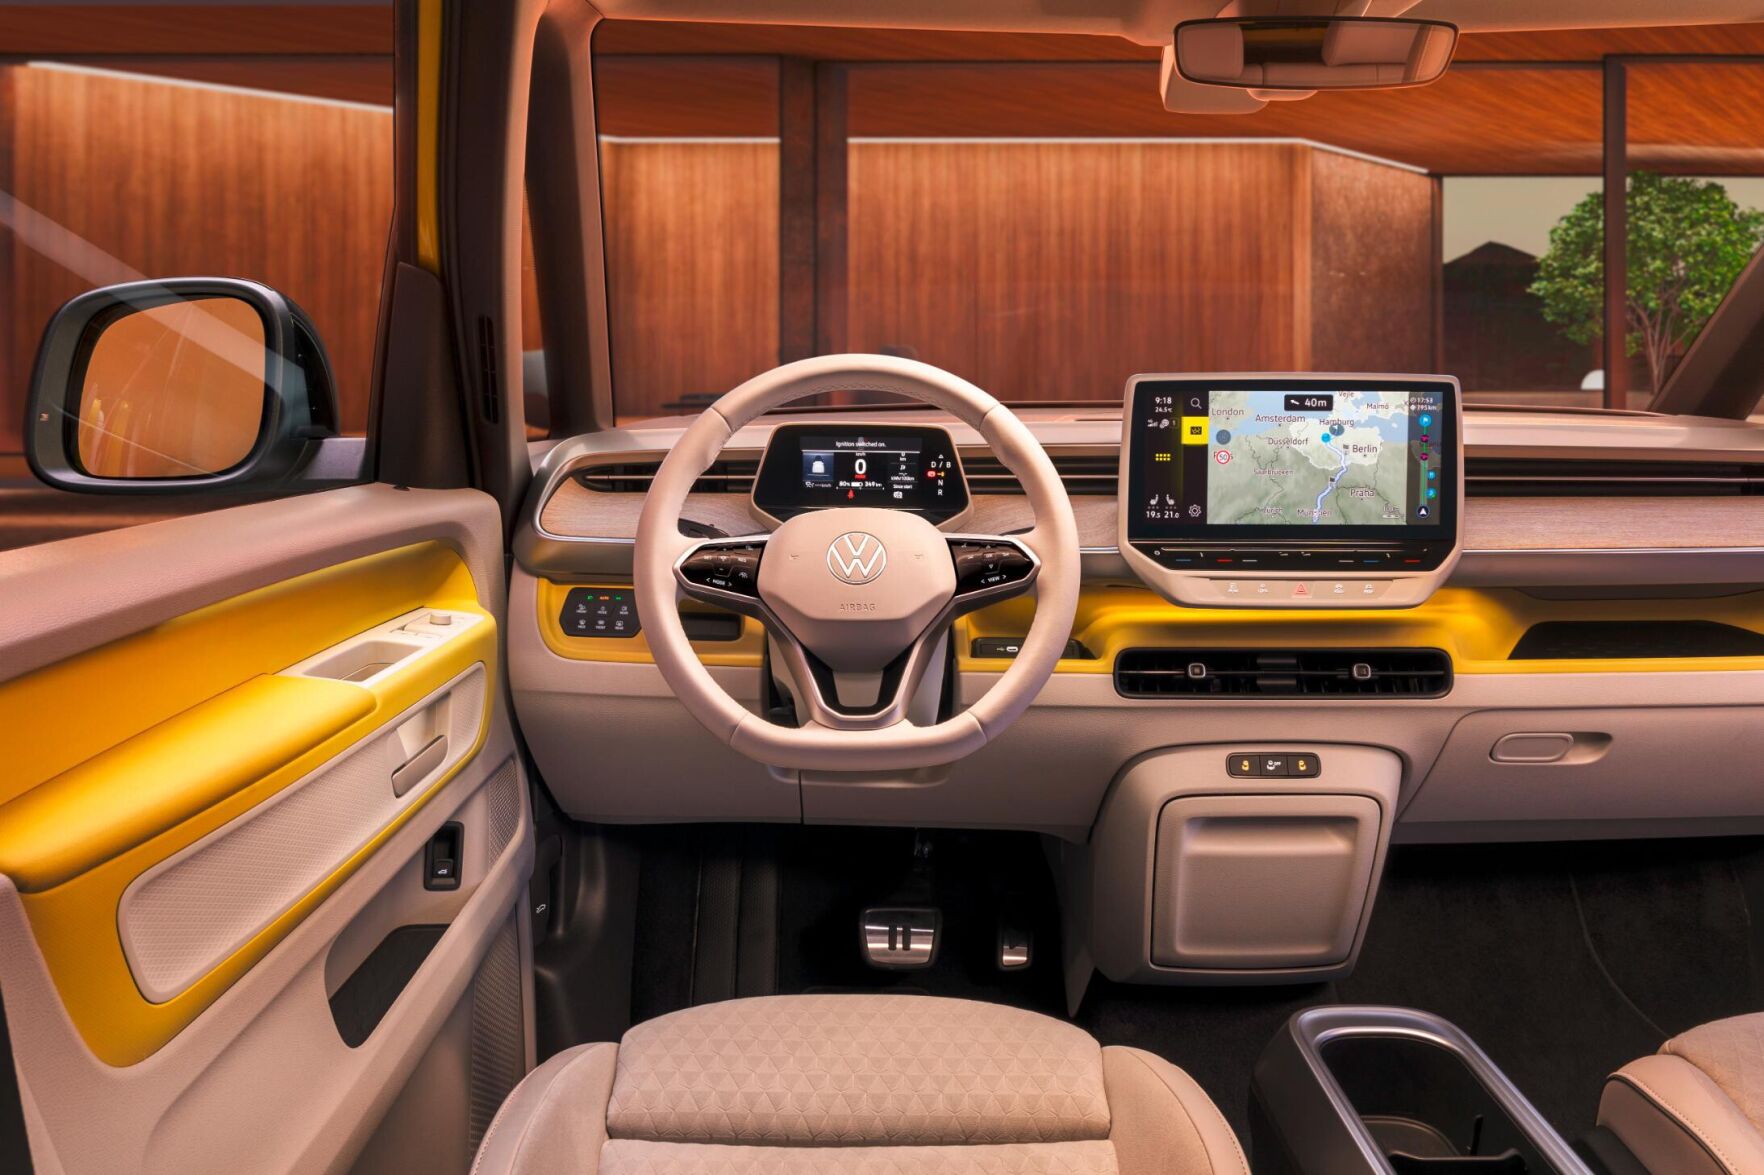
Inside, the ID. Buzz has features similar to those in the ID.4, such as a gear selection knob behind the steering that can be twisted to put the van into drive or reverse. A light bar running underneath the windshield uses colors to communicate to the driver things like an obstacle in the way or an upcoming turn for navigation. The gauge cluster is a rectangular digital screen. There is a 10-inch touchscreen for navigation and entertainment, and a 12-inch screen will be available as an option.
Martin Meiners/Volkswagen
The interior shares some features with VW's other EV models.
The ID. Buzz will have no leather in its interior, using leather substitutes, instead. There will also be fabrics made entirely from recycled plastics.
The electric bus will be available globally in two lengths, standard and long wheelbase. Only the long wheelbase version will be sold in the US. The standard version will be able to seat five, but a six-seat version will come later. The long wheelbase version will have seating for as many as seven. VW will also be offering cargo van versions with seating for three in front — the driver will have an individual seat with a two-person bench next to them. A wall behind the occupants will keep the cargo area separate.
The ID. Buzz revealed on Tuesday will go on sale in Europe later this year. VW has not yet provided pricing. The technical details could be slightly different for the version that will be available in North America in 2024. That version will be revealed next year.
___
-
Mercedes says its electric concept has 620 miles of range and seats made with mushroomsShutterstock
Photo Credit: buffaloboy / Shutterstock
Encouraging the adoption of electric vehicles is a high priority for many policymakers and environmentalists concerned with how to limit carbon emissions. President Joe Biden in August signed an executive order setting ambitious new targets for the sale of hybrid and electric vehicles, and Biden’s American Jobs Plan proposal included a $174 billion investment in electric vehicle production and adoption along with charging infrastructure.
Consumer demand for EVs has already been trending upward as the technology behind electric vehicles has improved. The total stock of electric vehicles worldwide hit 10 million in 2020, a 43% increase over the prior year. And while much of the auto market took a hit during the pandemic, demand for EV was more resilient than for other vehicle types.
Most of this growth in the industry has happened very recently. While electric vehicles were a competitor to the internal combustion engine when automobiles were first manufactured in the late 1800s and early 1900s, they fell out of vogue and were uncommon on the market until the last few decades. The 1990s saw the introduction of some new hybrid and plug-in electric vehicle models from major manufacturers like Toyota and GM. After Tesla emerged in the mid-2000s, offering longer-range, luxury models that proved popular with drivers, more major manufacturers began to offer new EV models. Over just a decade, the number of EV models on the market rose from only one in 2009 to 72 in 2019, according to data from the U.S. Department of Energy.
ShutterstockPhoto Credit: buffaloboy / Shutterstock
Encouraging the adoption of electric vehicles is a high priority for many policymakers and environmentalists concerned with how to limit carbon emissions. President Joe Biden in August signed an executive order setting ambitious new targets for the sale of hybrid and electric vehicles, and Biden’s American Jobs Plan proposal included a $174 billion investment in electric vehicle production and adoption along with charging infrastructure.
Consumer demand for EVs has already been trending upward as the technology behind electric vehicles has improved. The total stock of electric vehicles worldwide hit 10 million in 2020, a 43% increase over the prior year. And while much of the auto market took a hit during the pandemic, demand for EV was more resilient than for other vehicle types.
Most of this growth in the industry has happened very recently. While electric vehicles were a competitor to the internal combustion engine when automobiles were first manufactured in the late 1800s and early 1900s, they fell out of vogue and were uncommon on the market until the last few decades. The 1990s saw the introduction of some new hybrid and plug-in electric vehicle models from major manufacturers like Toyota and GM. After Tesla emerged in the mid-2000s, offering longer-range, luxury models that proved popular with drivers, more major manufacturers began to offer new EV models. Over just a decade, the number of EV models on the market rose from only one in 2009 to 72 in 2019, according to data from the U.S. Department of Energy.
-
Mercedes says its electric concept has 620 miles of range and seats made with mushrooms
Improvements in battery life and charging technology have been a major force in speeding the growth of electric vehicles. As recently as a few years ago, some of the top all-electric vehicle models had a range of less than 100 miles, and the battery charging infrastructure in the U.S. was limited. These factors made electric vehicles less viable for longer trips and limited their uptake with consumers. In more recent years, however, research and investment from the U.S. Department of Energy, startups like Tesla, and traditional auto giants like General Motors have given batteries a longer range and made them easier to charge with more charging stations and improved charging times.
Charging infrastructure remains a barrier in many locations, however. Chargers break down into three categories: Level 1 chargers, which use a 120-volt household outlet and add between two and five miles of range per hour; Level 2 chargers, which replenish at an average rate of about 10 to 20 miles of range per hour; and Level 3 chargers (also known as DC Fast Charging), which use direct current and higher voltage to recharge EVs at a rate of up to four miles per minute (240 miles per hour). Currently, Level 2 chargers represent the bulk of publicly available charging stations, with more than 80% of the total, while Level 3 chargers represent only around 18% of the public EV chargers. Expanding the supply of Level 3 chargers nationwide would make charging more convenient for more consumers.
-
-
Mercedes says its electric concept has 620 miles of range and seats made with mushrooms
Because of the uneven distribution of charging technology, some areas are more convenient than others to have an electric vehicle, and California tops the list. In addition to leading the nation in electric vehicle sales and market share, California also has the nation’s strongest charging infrastructure, accounting for roughly 30% of all U.S. electric vehicle charging stations. California’s dominance in EVs is unsurprising given that market leader Tesla is based in the state and the state government has supported EV adoption, including a recent executive order that mandates all new cars and passenger trucks sold in California be zero-emission vehicles by 2035.
Because of the uneven distribution of charging technology, some areas are more convenient than others to have an electric vehicle, and California tops the list. In addition to leading the nation in electric vehicle sales and market share, California also has the nation’s strongest charging infrastructure, accounting for roughly 30% of all U.S. electric vehicle charging stations. California’s dominance in EVs is unsurprising given that market leader Tesla is based in the state and the state government has supported EV adoption, including a recent executive order that mandates all new cars and passenger trucks sold in California be zero-emission vehicles by 2035.
-
Mercedes says its electric concept has 620 miles of range and seats made with mushrooms
But on a per-vehicle basis, one state tops California in the number of EV charging stations: Vermont. The Green Mountain State is one of the smallest states in population and area, so its more than 300 electric charging stations are more highly concentrated than in many other larger and more populous states.
The data used in this analysis is from the U.S. Department of Energy and the U.S. Department of Transportation. To determine the states with the most electric vehicle charging stations, researchers at Commodity.com calculated the total electric vehicle charging stations per 100k registered vehicles for each state. In the event of a tie, the state with more charging ports per 100k registered vehicles was ranked higher.
Here are the states with the most EV charging stations.
-
-
Mercedes says its electric concept has 620 miles of range and seats made with mushroomsShutterstock
Photo Credit: Sean Pavone / Shutterstock
- Total EV charging stations per 100k registered vehicles: 17.1
- Total EV charging ports per 100k registered vehicles: 35.1
- Total EV charging stations: 459
- Total EV charging ports: 942
- Total level 2 ports: 830
- Total level 3 ports (DC fast chargers): 110
ShutterstockPhoto Credit: Sean Pavone / Shutterstock
- Total EV charging stations per 100k registered vehicles: 17.1
- Total EV charging ports per 100k registered vehicles: 35.1
- Total EV charging stations: 459
- Total EV charging ports: 942
- Total level 2 ports: 830
- Total level 3 ports (DC fast chargers): 110
-
Mercedes says its electric concept has 620 miles of range and seats made with mushroomsShutterstock
Photo Credit: Sean Pavone / Shutterstock
- Total EV charging stations per 100k registered vehicles: 17.3
- Total EV charging ports per 100k registered vehicles: 43.8
- Total EV charging stations: 1,490
- Total EV charging ports: 3,763
- Total level 2 ports: 3,004
- Total level 3 ports (DC fast chargers): 559
ShutterstockPhoto Credit: Sean Pavone / Shutterstock
- Total EV charging stations per 100k registered vehicles: 17.3
- Total EV charging ports per 100k registered vehicles: 43.8
- Total EV charging stations: 1,490
- Total EV charging ports: 3,763
- Total level 2 ports: 3,004
- Total level 3 ports (DC fast chargers): 559
-
-
Mercedes says its electric concept has 620 miles of range and seats made with mushroomsShutterstock
Photo Credit: Sean Pavone / Shutterstock
- Total EV charging stations per 100k registered vehicles: 17.8
- Total EV charging ports per 100k registered vehicles: 37.6
- Total EV charging stations: 985
- Total EV charging ports: 2,080
- Total level 2 ports: 1,848
- Total level 3 ports (DC fast chargers): 227
ShutterstockPhoto Credit: Sean Pavone / Shutterstock
- Total EV charging stations per 100k registered vehicles: 17.8
- Total EV charging ports per 100k registered vehicles: 37.6
- Total EV charging stations: 985
- Total EV charging ports: 2,080
- Total level 2 ports: 1,848
- Total level 3 ports (DC fast chargers): 227
-
Mercedes says its electric concept has 620 miles of range and seats made with mushroomsShutterstock
Photo Credit: f11photo / Shutterstock
- Total EV charging stations per 100k registered vehicles: 20.9
- Total EV charging ports per 100k registered vehicles: 50.9
- Total EV charging stations: 1,541
- Total EV charging ports: 3,757
- Total level 2 ports: 2,978
- Total level 3 ports (DC fast chargers): 699
ShutterstockPhoto Credit: f11photo / Shutterstock
- Total EV charging stations per 100k registered vehicles: 20.9
- Total EV charging ports per 100k registered vehicles: 50.9
- Total EV charging stations: 1,541
- Total EV charging ports: 3,757
- Total level 2 ports: 2,978
- Total level 3 ports (DC fast chargers): 699
-
-
Mercedes says its electric concept has 620 miles of range and seats made with mushroomsShutterstock
Photo Credit: Sean Pavone / Shutterstock
- Total EV charging stations per 100k registered vehicles: 22.7
- Total EV charging ports per 100k registered vehicles: 54.4
- Total EV charging stations: 889
- Total EV charging ports: 2,133
- Total level 2 ports: 1,673
- Total level 3 ports (DC fast chargers): 416
ShutterstockPhoto Credit: Sean Pavone / Shutterstock
- Total EV charging stations per 100k registered vehicles: 22.7
- Total EV charging ports per 100k registered vehicles: 54.4
- Total EV charging stations: 889
- Total EV charging ports: 2,133
- Total level 2 ports: 1,673
- Total level 3 ports (DC fast chargers): 416
-
Mercedes says its electric concept has 620 miles of range and seats made with mushroomsShutterstock
Photo Credit: Sean Pavone / Shutterstock
- Total EV charging stations per 100k registered vehicles: 23.2
- Total EV charging ports per 100k registered vehicles: 48.6
- Total EV charging stations: 262
- Total EV charging ports: 549
- Total level 2 ports: 412
- Total level 3 ports (DC fast chargers): 131
ShutterstockPhoto Credit: Sean Pavone / Shutterstock
- Total EV charging stations per 100k registered vehicles: 23.2
- Total EV charging ports per 100k registered vehicles: 48.6
- Total EV charging stations: 262
- Total EV charging ports: 549
- Total level 2 ports: 412
- Total level 3 ports (DC fast chargers): 131
-
-
Mercedes says its electric concept has 620 miles of range and seats made with mushroomsShutterstock
Photo Credit: Sean Pavone / Shutterstock
- Total EV charging stations per 100k registered vehicles: 23.8
- Total EV charging ports per 100k registered vehicles: 57.9
- Total EV charging stations: 2,710
- Total EV charging ports: 6,593
- Total level 2 ports: 5,816
- Total level 3 ports (DC fast chargers): 762
ShutterstockPhoto Credit: Sean Pavone / Shutterstock
- Total EV charging stations per 100k registered vehicles: 23.8
- Total EV charging ports per 100k registered vehicles: 57.9
- Total EV charging stations: 2,710
- Total EV charging ports: 6,593
- Total level 2 ports: 5,816
- Total level 3 ports (DC fast chargers): 762
-
Mercedes says its electric concept has 620 miles of range and seats made with mushroomsShutterstock
Photo Credit: Sean Pavone / Shutterstock
- Total EV charging stations per 100k registered vehicles: 25.8
- Total EV charging ports per 100k registered vehicles: 67.6
- Total EV charging stations: 1,083
- Total EV charging ports: 2,840
- Total level 2 ports: 2,317
- Total level 3 ports (DC fast chargers): 502
ShutterstockPhoto Credit: Sean Pavone / Shutterstock
- Total EV charging stations per 100k registered vehicles: 25.8
- Total EV charging ports per 100k registered vehicles: 67.6
- Total EV charging stations: 1,083
- Total EV charging ports: 2,840
- Total level 2 ports: 2,317
- Total level 3 ports (DC fast chargers): 502
-
-
Mercedes says its electric concept has 620 miles of range and seats made with mushroomsShutterstock
Photo Credit: Mihai Andritoiu / Shutterstock
- Total EV charging stations per 100k registered vehicles: 26.5
- Total EV charging ports per 100k registered vehicles: 60.2
- Total EV charging stations: 230
- Total EV charging ports: 523
- Total level 2 ports: 468
- Total level 3 ports (DC fast chargers): 35
ShutterstockPhoto Credit: Mihai Andritoiu / Shutterstock
- Total EV charging stations per 100k registered vehicles: 26.5
- Total EV charging ports per 100k registered vehicles: 60.2
- Total EV charging stations: 230
- Total EV charging ports: 523
- Total level 2 ports: 468
- Total level 3 ports (DC fast chargers): 35
-
Mercedes says its electric concept has 620 miles of range and seats made with mushroomsShutterstock
Photo Credit: Sean Pavone / Shutterstock
- Total EV charging stations per 100k registered vehicles: 26.5
- Total EV charging ports per 100k registered vehicles: 62.7
- Total EV charging stations: 1,432
- Total EV charging ports: 3,391
- Total level 2 ports: 2,804
- Total level 3 ports (DC fast chargers): 526
ShutterstockPhoto Credit: Sean Pavone / Shutterstock
- Total EV charging stations per 100k registered vehicles: 26.5
- Total EV charging ports per 100k registered vehicles: 62.7
- Total EV charging stations: 1,432
- Total EV charging ports: 3,391
- Total level 2 ports: 2,804
- Total level 3 ports (DC fast chargers): 526
-
-
Mercedes says its electric concept has 620 miles of range and seats made with mushroomsShutterstock
Photo Credit: Dave H. Fine / Shutterstock
- Total EV charging stations per 100k registered vehicles: 28.7
- Total EV charging ports per 100k registered vehicles: 59.4
- Total EV charging stations: 365
- Total EV charging ports: 756
- Total level 2 ports: 668
- Total level 3 ports (DC fast chargers): 83
ShutterstockPhoto Credit: Dave H. Fine / Shutterstock
- Total EV charging stations per 100k registered vehicles: 28.7
- Total EV charging ports per 100k registered vehicles: 59.4
- Total EV charging stations: 365
- Total EV charging ports: 756
- Total level 2 ports: 668
- Total level 3 ports (DC fast chargers): 83
-
Mercedes says its electric concept has 620 miles of range and seats made with mushroomsShutterstock
Photo Credit: Sean Pavone / Shutterstock
- Total EV charging stations per 100k registered vehicles: 35.3
- Total EV charging ports per 100k registered vehicles: 73.5
- Total EV charging stations: 857
- Total EV charging ports: 1,787
- Total level 2 ports: 1,590
- Total level 3 ports (DC fast chargers): 195
ShutterstockPhoto Credit: Sean Pavone / Shutterstock
- Total EV charging stations per 100k registered vehicles: 35.3
- Total EV charging ports per 100k registered vehicles: 73.5
- Total EV charging stations: 857
- Total EV charging ports: 1,787
- Total level 2 ports: 1,590
- Total level 3 ports (DC fast chargers): 195
-
-
Mercedes says its electric concept has 620 miles of range and seats made with mushroomsShutterstock
Photo Credit: Sean Pavone / Shutterstock
- Total EV charging stations per 100k registered vehicles: 37.2
- Total EV charging ports per 100k registered vehicles: 82.1
- Total EV charging stations: 1,881
- Total EV charging ports: 4,156
- Total level 2 ports: 3,760
- Total level 3 ports (DC fast chargers): 383
ShutterstockPhoto Credit: Sean Pavone / Shutterstock
- Total EV charging stations per 100k registered vehicles: 37.2
- Total EV charging ports per 100k registered vehicles: 82.1
- Total EV charging stations: 1,881
- Total EV charging ports: 4,156
- Total level 2 ports: 3,760
- Total level 3 ports (DC fast chargers): 383
-
Mercedes says its electric concept has 620 miles of range and seats made with mushroomsShutterstock
Photo Credit: Chones / Shutterstock
- Total EV charging stations per 100k registered vehicles: 42.7
- Total EV charging ports per 100k registered vehicles: 109.7
- Total EV charging stations: 13,347
- Total EV charging ports: 34,266
- Total level 2 ports: 27,797
- Total level 3 ports (DC fast chargers): 6,158
ShutterstockPhoto Credit: Chones / Shutterstock
- Total EV charging stations per 100k registered vehicles: 42.7
- Total EV charging ports per 100k registered vehicles: 109.7
- Total EV charging stations: 13,347
- Total EV charging ports: 34,266
- Total level 2 ports: 27,797
- Total level 3 ports (DC fast chargers): 6,158
-
-
Mercedes says its electric concept has 620 miles of range and seats made with mushroomsShutterstock
Photo Credit: Sean Pavone / Shutterstock
- Total EV charging stations per 100k registered vehicles: 49.8
- Total EV charging ports per 100k registered vehicles: 133.9
- Total EV charging stations: 309
- Total EV charging ports: 831
- Total level 2 ports: 685
- Total level 3 ports (DC fast chargers): 75
ShutterstockPhoto Credit: Sean Pavone / Shutterstock
- Total EV charging stations per 100k registered vehicles: 49.8
- Total EV charging ports per 100k registered vehicles: 133.9
- Total EV charging stations: 309
- Total EV charging ports: 831
- Total level 2 ports: 685
- Total level 3 ports (DC fast chargers): 75
-
Volkswagen’s bus is finally back. And now it’s electricShutterstock
Photo Credit: Virrage Images / Shutterstock
In the ongoing efforts to combat global climate change, one of the most promising trends has been a growing shift away from carbon-emitting vehicles. Transportation produces 29% of greenhouse gas emissions in the U.S., according to the EPA, but hybrid and electric vehicles are growing in popularity and potentially poised to reduce that figure.
Part of this shift has come with encouragement from policymakers. Recognizing the role that fuel emissions play in contributing to the greenhouse gas effect and climate change, policymakers at all levels have been encouraging a transition toward lower- or zero-emission vehicles. Hybrid and electric vehicle owners are frequently eligible for government incentives like tax credits. States like California are planning to phase out new carbon-emitting vehicles from the market altogether by 2035. More recently, the Biden Administration and Congress have been making efforts to expand the national network of electric vehicle charging stations among other climate-related infrastructure projects.
Simultaneously, the market for hybrid and electric cars has never been larger. In October, electric vehicle market leader Tesla became one of only a handful of companies ever to reach a $1 trillion market capitalization, following a surge in sales and the announcement of a $4 billion partnership with Hertz to provide 100,000 rental vehicles. Meanwhile, entrenched auto industry manufacturers like GM, Toyota, BMW, and many others are racing to catch up to Tesla, offering an increasingly large variety of high-performing vehicles that have greater fuel economy and lower or no emissions.
And over the last few months, some consumers have been looking to the electric vehicle market for another reason: the rising price of gasoline.
ShutterstockPhoto Credit: Virrage Images / Shutterstock
In the ongoing efforts to combat global climate change, one of the most promising trends has been a growing shift away from carbon-emitting vehicles. Transportation produces 29% of greenhouse gas emissions in the U.S., according to the EPA, but hybrid and electric vehicles are growing in popularity and potentially poised to reduce that figure.
Part of this shift has come with encouragement from policymakers. Recognizing the role that fuel emissions play in contributing to the greenhouse gas effect and climate change, policymakers at all levels have been encouraging a transition toward lower- or zero-emission vehicles. Hybrid and electric vehicle owners are frequently eligible for government incentives like tax credits. States like California are planning to phase out new carbon-emitting vehicles from the market altogether by 2035. More recently, the Biden Administration and Congress have been making efforts to expand the national network of electric vehicle charging stations among other climate-related infrastructure projects.
Simultaneously, the market for hybrid and electric cars has never been larger. In October, electric vehicle market leader Tesla became one of only a handful of companies ever to reach a $1 trillion market capitalization, following a surge in sales and the announcement of a $4 billion partnership with Hertz to provide 100,000 rental vehicles. Meanwhile, entrenched auto industry manufacturers like GM, Toyota, BMW, and many others are racing to catch up to Tesla, offering an increasingly large variety of high-performing vehicles that have greater fuel economy and lower or no emissions.
And over the last few months, some consumers have been looking to the electric vehicle market for another reason: the rising price of gasoline.
-
-
Volkswagen’s bus is finally back. And now it’s electric
Gasoline prices have been fairly volatile over the last two decades, and the trajectory of gas prices during the COVID-19 pandemic provides one example. At the beginning of 2020, the average cost of a gallon of gas was $2.58. By the end of April, after the pandemic had taken hold and with lockdown orders still in effect in many jurisdictions, gasoline dipped to $1.77 per gallon. After staying under $2.25 for the rest of 2020, gas prices have dramatically increased this year, rising to $3.32 per gallon as of October 2021.
Even with elevated gas prices, however, consumption is likely to remain high until more hybrids and electric vehicles are on the road. Studies have found that demand for gas is mostly inelastic, meaning that people tend to purchase the same amount of gas regardless of the price. However, there does appear to be some correlation between the costs of gasoline in a state and the amount of miles drivers travel on the road.
-
Volkswagen’s bus is finally back. And now it’s electric
The states with the least expensive gasoline relative to the national average are primarily found in the South. Reasons for this include these states’ proximity to major petroleum sources or refineries in Texas and the Gulf Coast region, which lowers distribution costs, and lower gas taxes. Many of these states, like Mississippi, Alabama, and South Carolina, are also among the leaders in per capita vehicle miles traveled annually. In contrast, states in the West and Northeast have much higher costs of gasoline, and their drivers spend less time on the road. For instance, California has the third-highest gas prices of any state in the U.S. and ranks 42nd in vehicle-miles traveled per person.
When it comes to gasoline consumption, vehicle-miles traveled is also a major indicator. Rural states, mostly in the South, Midwest, and Mountain West, rank highly on both gasoline consumption and miles traveled because of their lower density and lack of other transportation alternatives. To determine the states consuming the most gasoline, researchers at Commodity.com calculated per capita annual gasoline consumption in gallons using data from the U.S. Energy Information Administration and the U.S. Department of Transportation. In the event of a tie, the state with the higher per capita annual gasoline expenditures was ranked higher.
Here are the states consuming the most gasoline.
-
-
Volkswagen’s bus is finally back. And now it’s electricShutterstock
Photo Credit: f11photo / Shutterstock
- Per capita annual gasoline consumption (gallons): 492
- Per capita annual gasoline expenditures: $1,203
- Total annual gasoline consumption (gallons): 1,553,573,619
- Total annual gasoline expenditures: $3,801,000,000
- Average price per gallon of gasoline (compared to average): -5.9%
- Per capita annual vehicle-miles traveled: 10,601
ShutterstockPhoto Credit: f11photo / Shutterstock
- Per capita annual gasoline consumption (gallons): 492
- Per capita annual gasoline expenditures: $1,203
- Total annual gasoline consumption (gallons): 1,553,573,619
- Total annual gasoline expenditures: $3,801,000,000
- Average price per gallon of gasoline (compared to average): -5.9%
- Per capita annual vehicle-miles traveled: 10,601
-
Volkswagen’s bus is finally back. And now it’s electricShutterstock
Photo Credit: Jonny Trego / Shutterstock
- Per capita annual gasoline consumption (gallons): 497
- Per capita annual gasoline expenditures: $1,237
- Total annual gasoline consumption (gallons): 2,223,504,645
- Total annual gasoline expenditures: $5,531,000,000
- Average price per gallon of gasoline (compared to average): -4.3%
- Per capita annual vehicle-miles traveled: 11,036
ShutterstockPhoto Credit: Jonny Trego / Shutterstock
- Per capita annual gasoline consumption (gallons): 497
- Per capita annual gasoline expenditures: $1,237
- Total annual gasoline consumption (gallons): 2,223,504,645
- Total annual gasoline expenditures: $5,531,000,000
- Average price per gallon of gasoline (compared to average): -4.3%
- Per capita annual vehicle-miles traveled: 11,036
-
-
Volkswagen’s bus is finally back. And now it’s electricShutterstock
Photo Credit: Sean Pavone / Shutterstock
- Per capita annual gasoline consumption (gallons): 501
- Per capita annual gasoline expenditures: $1,209
- Total annual gasoline consumption (gallons): 3,418,976,274
- Total annual gasoline expenditures: $8,258,000,000
- Average price per gallon of gasoline (compared to average): -7.1%
- Per capita annual vehicle-miles traveled: 12,036
ShutterstockPhoto Credit: Sean Pavone / Shutterstock
- Per capita annual gasoline consumption (gallons): 501
- Per capita annual gasoline expenditures: $1,209
- Total annual gasoline consumption (gallons): 3,418,976,274
- Total annual gasoline expenditures: $8,258,000,000
- Average price per gallon of gasoline (compared to average): -7.1%
- Per capita annual vehicle-miles traveled: 12,036
-
Volkswagen’s bus is finally back. And now it’s electricShutterstock
Photo Credit: Mihai_Andritoiu / Shutterstock
- Per capita annual gasoline consumption (gallons): 502
- Per capita annual gasoline expenditures: $1,390
- Total annual gasoline consumption (gallons): 537,487,105
- Total annual gasoline expenditures: $1,487,000,000
- Average price per gallon of gasoline (compared to average): +6.4%
- Per capita annual vehicle-miles traveled: 11,931
ShutterstockPhoto Credit: Mihai_Andritoiu / Shutterstock
- Per capita annual gasoline consumption (gallons): 502
- Per capita annual gasoline expenditures: $1,390
- Total annual gasoline consumption (gallons): 537,487,105
- Total annual gasoline expenditures: $1,487,000,000
- Average price per gallon of gasoline (compared to average): +6.4%
- Per capita annual vehicle-miles traveled: 11,931
-
-
Volkswagen’s bus is finally back. And now it’s electricShutterstock
Photo Credit: Timothy Milan Kuret / Shutterstock
- Per capita annual gasoline consumption (gallons): 505
- Per capita annual gasoline expenditures: $1,159
- Total annual gasoline consumption (gallons): 14,645,221,408
- Total annual gasoline expenditures: $33,594,000,000
- Average price per gallon of gasoline (compared to average): -11.8%
- Per capita annual vehicle-miles traveled: 9,817
ShutterstockPhoto Credit: Timothy Milan Kuret / Shutterstock
- Per capita annual gasoline consumption (gallons): 505
- Per capita annual gasoline expenditures: $1,159
- Total annual gasoline consumption (gallons): 14,645,221,408
- Total annual gasoline expenditures: $33,594,000,000
- Average price per gallon of gasoline (compared to average): -11.8%
- Per capita annual vehicle-miles traveled: 9,817
-
Volkswagen’s bus is finally back. And now it’s electricShutterstock
Photo Credit: Trong Nguyen / Shutterstock
- Per capita annual gasoline consumption (gallons): 505
- Per capita annual gasoline expenditures: $1,165
- Total annual gasoline consumption (gallons): 1,524,939,471
- Total annual gasoline expenditures: $3,520,000,000
- Average price per gallon of gasoline (compared to average): -11.2%
- Per capita annual vehicle-miles traveled: 12,242
ShutterstockPhoto Credit: Trong Nguyen / Shutterstock
- Per capita annual gasoline consumption (gallons): 505
- Per capita annual gasoline expenditures: $1,165
- Total annual gasoline consumption (gallons): 1,524,939,471
- Total annual gasoline expenditures: $3,520,000,000
- Average price per gallon of gasoline (compared to average): -11.2%
- Per capita annual vehicle-miles traveled: 12,242
-
-
Volkswagen’s bus is finally back. And now it’s electricShutterstock
Photo Credit: Tupungato / Shutterstock
- Per capita annual gasoline consumption (gallons): 509
- Per capita annual gasoline expenditures: $1,209
- Total annual gasoline consumption (gallons): 3,127,887,990
- Total annual gasoline expenditures: $7,427,000,000
- Average price per gallon of gasoline (compared to average): -8.7%
- Per capita annual vehicle-miles traveled: 12,870
ShutterstockPhoto Credit: Tupungato / Shutterstock
- Per capita annual gasoline consumption (gallons): 509
- Per capita annual gasoline expenditures: $1,209
- Total annual gasoline consumption (gallons): 3,127,887,990
- Total annual gasoline expenditures: $7,427,000,000
- Average price per gallon of gasoline (compared to average): -8.7%
- Per capita annual vehicle-miles traveled: 12,870
-
Volkswagen’s bus is finally back. And now it’s electricShutterstock
Photo Credit: Jacob Boomsma / Shutterstock
- Per capita annual gasoline consumption (gallons): 523
- Per capita annual gasoline expenditures: $1,325
- Total annual gasoline consumption (gallons): 464,451,253
- Total annual gasoline expenditures: $1,176,000,000
- Average price per gallon of gasoline (compared to average): -2.6%
- Per capita annual vehicle-miles traveled: 11,114
ShutterstockPhoto Credit: Jacob Boomsma / Shutterstock
- Per capita annual gasoline consumption (gallons): 523
- Per capita annual gasoline expenditures: $1,325
- Total annual gasoline consumption (gallons): 464,451,253
- Total annual gasoline expenditures: $1,176,000,000
- Average price per gallon of gasoline (compared to average): -2.6%
- Per capita annual vehicle-miles traveled: 11,114
-
-
Volkswagen’s bus is finally back. And now it’s electricShutterstock
Photo Credit: Jon Bilous / Shutterstock
- Per capita annual gasoline consumption (gallons): 532
- Per capita annual gasoline expenditures: $1,356
- Total annual gasoline consumption (gallons): 724,194,683
- Total annual gasoline expenditures: $1,845,000,000
- Average price per gallon of gasoline (compared to average): -2.0%
- Per capita annual vehicle-miles traveled: 10,121
ShutterstockPhoto Credit: Jon Bilous / Shutterstock
- Per capita annual gasoline consumption (gallons): 532
- Per capita annual gasoline expenditures: $1,356
- Total annual gasoline consumption (gallons): 724,194,683
- Total annual gasoline expenditures: $1,845,000,000
- Average price per gallon of gasoline (compared to average): -2.0%
- Per capita annual vehicle-miles traveled: 10,121
-
Volkswagen’s bus is finally back. And now it’s electricShutterstock
Photo Credit: f11photo / Shutterstock
- Per capita annual gasoline consumption (gallons): 549
- Per capita annual gasoline expenditures: $1,261
- Total annual gasoline consumption (gallons): 2,834,788,130
- Total annual gasoline expenditures: $6,506,000,000
- Average price per gallon of gasoline (compared to average): -11.7%
- Per capita annual vehicle-miles traveled: 11,104
ShutterstockPhoto Credit: f11photo / Shutterstock
- Per capita annual gasoline consumption (gallons): 549
- Per capita annual gasoline expenditures: $1,261
- Total annual gasoline consumption (gallons): 2,834,788,130
- Total annual gasoline expenditures: $6,506,000,000
- Average price per gallon of gasoline (compared to average): -11.7%
- Per capita annual vehicle-miles traveled: 11,104
-
-
Volkswagen’s bus is finally back. And now it’s electricShutterstock
Photo Credit: Jon Bilous / Shutterstock
- Per capita annual gasoline consumption (gallons): 561
- Per capita annual gasoline expenditures: $1,457
- Total annual gasoline consumption (gallons): 547,438,138
- Total annual gasoline expenditures: $1,423,000,000
- Average price per gallon of gasoline (compared to average): +0.0%
- Per capita annual vehicle-miles traveled: 10,382
ShutterstockPhoto Credit: Jon Bilous / Shutterstock
- Per capita annual gasoline consumption (gallons): 561
- Per capita annual gasoline expenditures: $1,457
- Total annual gasoline consumption (gallons): 547,438,138
- Total annual gasoline expenditures: $1,423,000,000
- Average price per gallon of gasoline (compared to average): +0.0%
- Per capita annual vehicle-miles traveled: 10,382
-
Volkswagen’s bus is finally back. And now it’s electricShutterstock
Photo Credit: Jacob Boomsma / Shutterstock
- Per capita annual gasoline consumption (gallons): 569
- Per capita annual gasoline expenditures: $1,474
- Total annual gasoline consumption (gallons): 330,146,731
- Total annual gasoline expenditures: $855,000,000
- Average price per gallon of gasoline (compared to average): -0.4%
- Per capita annual vehicle-miles traveled: 17,530
ShutterstockPhoto Credit: Jacob Boomsma / Shutterstock
- Per capita annual gasoline consumption (gallons): 569
- Per capita annual gasoline expenditures: $1,474
- Total annual gasoline consumption (gallons): 330,146,731
- Total annual gasoline expenditures: $855,000,000
- Average price per gallon of gasoline (compared to average): -0.4%
- Per capita annual vehicle-miles traveled: 17,530
-
-
Volkswagen’s bus is finally back. And now it’s electricShutterstock
Photo Credit: Sean Pavone / Shutterstock
- Per capita annual gasoline consumption (gallons): 570
- Per capita annual gasoline expenditures: $1,301
- Total annual gasoline consumption (gallons): 2,798,198,295
- Total annual gasoline expenditures: $6,385,000,000
- Average price per gallon of gasoline (compared to average): -12.2%
- Per capita annual vehicle-miles traveled: 14,576
ShutterstockPhoto Credit: Sean Pavone / Shutterstock
- Per capita annual gasoline consumption (gallons): 570
- Per capita annual gasoline expenditures: $1,301
- Total annual gasoline consumption (gallons): 2,798,198,295
- Total annual gasoline expenditures: $6,385,000,000
- Average price per gallon of gasoline (compared to average): -12.2%
- Per capita annual vehicle-miles traveled: 14,576
-
Volkswagen’s bus is finally back. And now it’s electricShutterstock
Photo Credit: Jacob Boomsma / Shutterstock
- Per capita annual gasoline consumption (gallons): 577
- Per capita annual gasoline expenditures: $1,498
- Total annual gasoline consumption (gallons): 440,308,622
- Total annual gasoline expenditures: $1,144,000,000
- Average price per gallon of gasoline (compared to average): +0.0%
- Per capita annual vehicle-miles traveled: 12,839
ShutterstockPhoto Credit: Jacob Boomsma / Shutterstock
- Per capita annual gasoline consumption (gallons): 577
- Per capita annual gasoline expenditures: $1,498
- Total annual gasoline consumption (gallons): 440,308,622
- Total annual gasoline expenditures: $1,144,000,000
- Average price per gallon of gasoline (compared to average): +0.0%
- Per capita annual vehicle-miles traveled: 12,839
-
-
Volkswagen’s bus is finally back. And now it’s electricShutterstock
Photo Credit: Sean Pavone / Shutterstock
- Per capita annual gasoline consumption (gallons): 578
- Per capita annual gasoline expenditures: $1,324
- Total annual gasoline consumption (gallons): 1,722,554,239
- Total annual gasoline expenditures: $3,943,000,000
- Average price per gallon of gasoline (compared to average): -11.9%
- Per capita annual vehicle-miles traveled: 13,850
ShutterstockPhoto Credit: Sean Pavone / Shutterstock
- Per capita annual gasoline consumption (gallons): 578
- Per capita annual gasoline expenditures: $1,324
- Total annual gasoline consumption (gallons): 1,722,554,239
- Total annual gasoline expenditures: $3,943,000,000
- Average price per gallon of gasoline (compared to average): -11.9%
- Per capita annual vehicle-miles traveled: 13,850