WASHINGTON — The natural burst of El Nino warming that changes weather worldwide is far costlier with longer-lasting expenses than experts had thought, averaging trillions of dollars in damage, a new study found.
An El Nino is brewing now and it might be a big — and therefore costly — one, scientists said. El Nino is a temporary and natural warming of parts of the equatorial Pacific that causes droughts, floods and heat waves in different parts of the world. It also adds a boost to human-caused warming.
The study in Thursday’s journal Science totals global damage with an emphasis on lasting economic scars. It runs counter to previous research that found, at least in the United States, that El Ninos overall aren’t too costly and can even be beneficial.
Some — but not all — outside economists have issues with the new research out of Dartmouth College, saying its damage estimates are too big.
Study authors said the average El Nino costs the global economy about $3.4 trillion. The strong 1997-1998 one cost $5.7 trillion. The World Bank estimated the 1997-1998 El Nino cost governments $45 billion, which is more than 100 times smaller than the Dartmouth estimate.
But the Dartmouth team said they are looking at more than the traditional costs and for longer time periods.
“We have this sense that El Nino is a really big hammer that hits the Earth system every few years. But we didn’t have as much of a handle on its sort of macroeconomic implications, both what that means just on a year-to-year basis and what that might mean with future global warming,” said study lead author Christopher Callahan, a climate impacts researcher at Dartmouth.
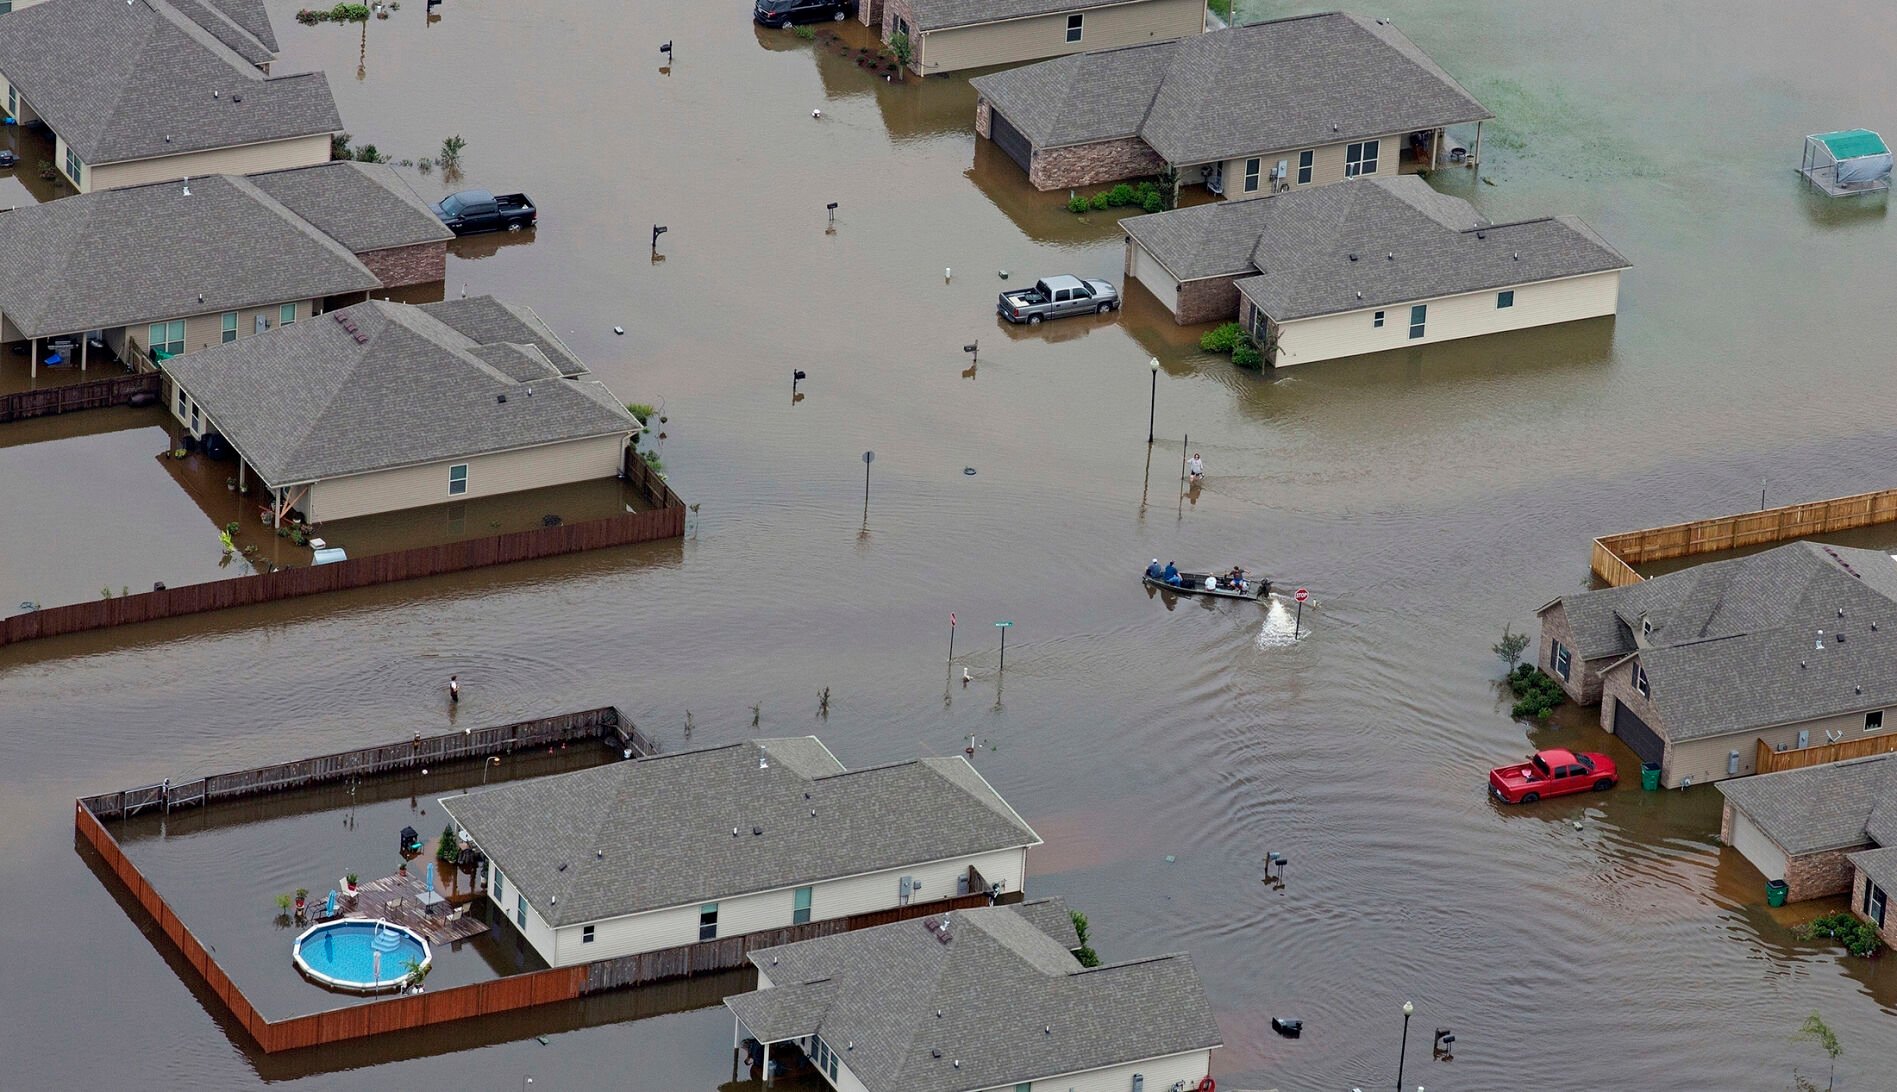
Max Becherer, Associated Press
A boat motors between flooded homes Aug. 13, 2016, after heavy rains inundated the region in Hammond, La.
“Economies bear the scars of El Nino for a decade or more and potentially forever,” said study co-author Justin Mankin, a Dartmouth climate scientist.
The economic scars are the diversion of spending away from technology and innovation toward recovery and rebuilding efforts, Callahan said. It’s about opportunities lost while digging out of the El Nino hole.
The way Callahan and Mankin did this was to simulate a world without an El Nino event and look at the global difference in costs, compared to the global gross domestic product, Mankin said.
El Nino’s biggest impacts generally hit in the northern winter, but in the summer it reduces hurricane activity in the Atlantic, studies show.
It makes it wetter across much of the U.S. South and West, Peru, Uruguay and Argentina, some of Southeast Asia, and a bit of east central Africa. It makes it drier in southeast Africa, southern Asia, northern Australia and the Amazon and often leads to increased wildfires in those areas. It’s warmer in much of Asia, the American Pacific Northwest and Australia.
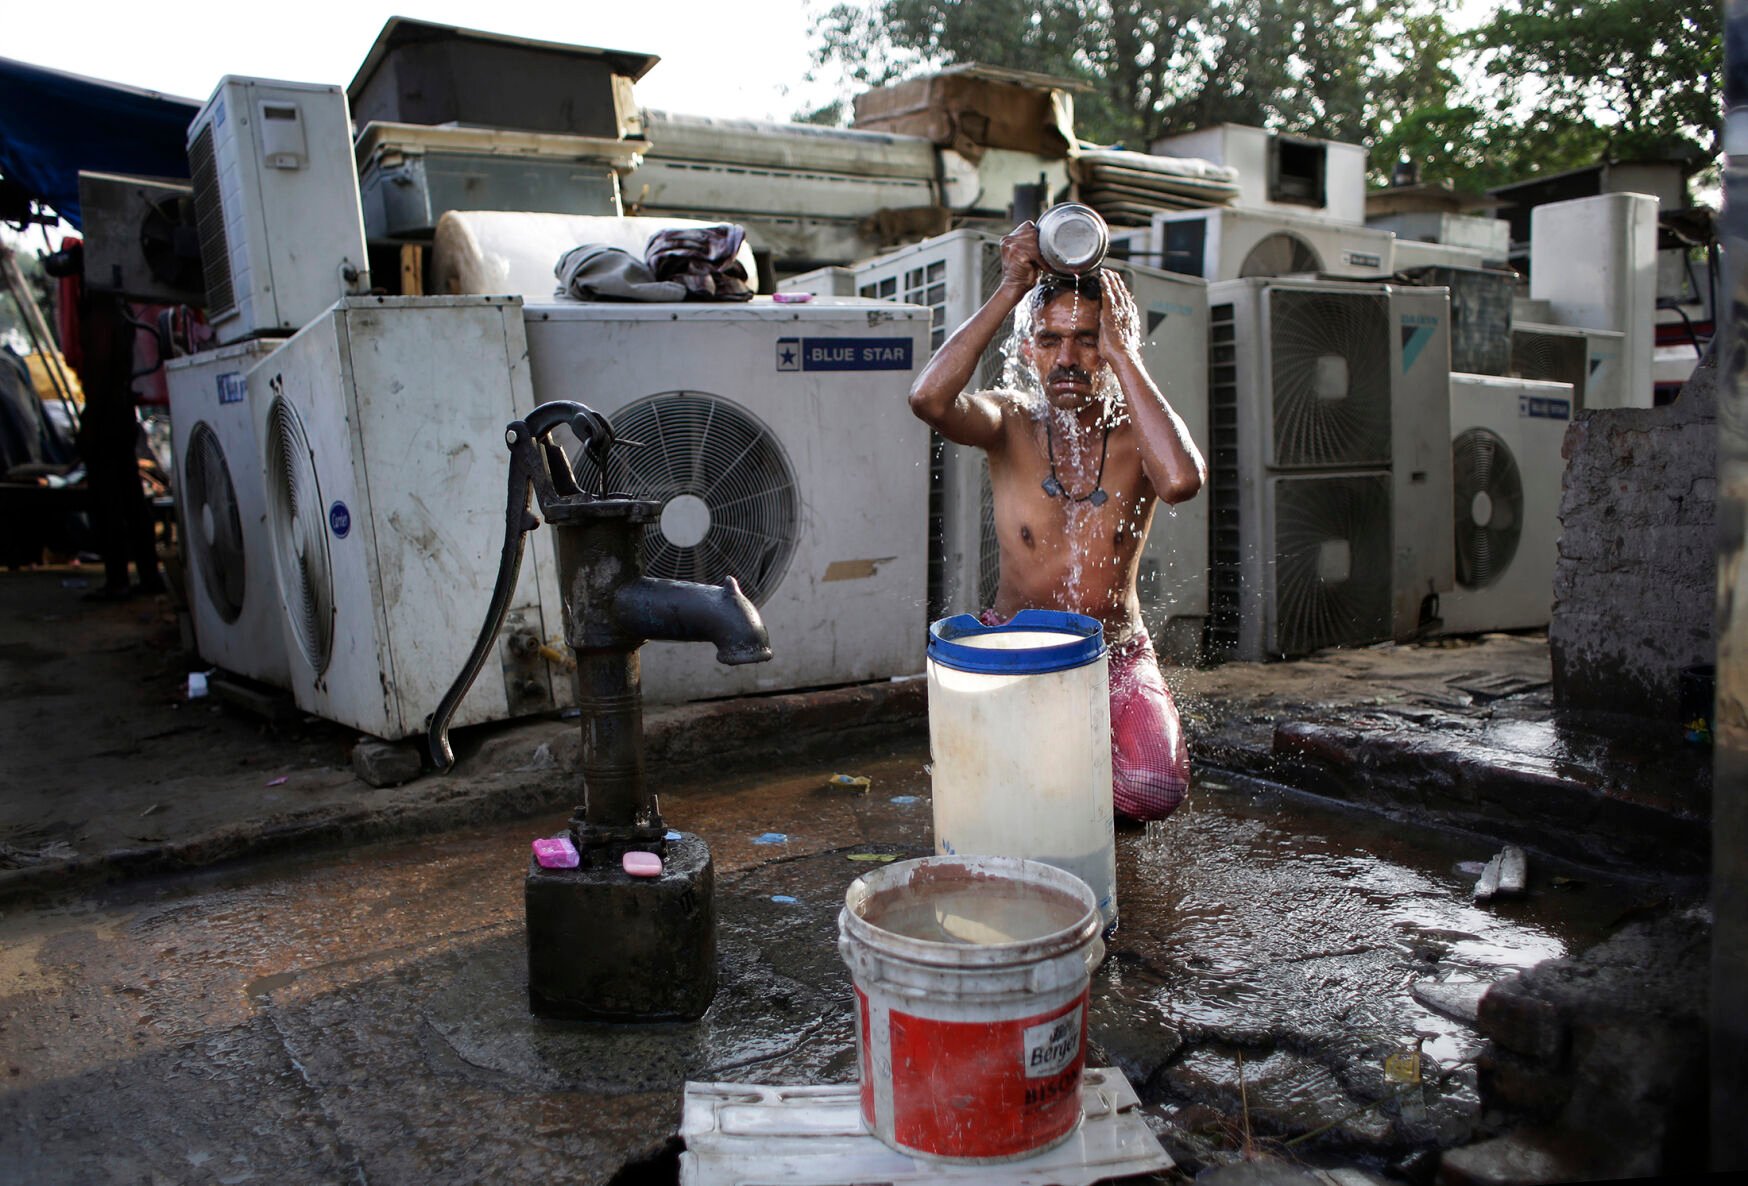
Altaf Qadri, Associated Press
A migrant daily wage worker bathes May 17, 2016, at a public well pump on a hot morning in New Delhi, India.
El Ninos occur on average about every three to five years and vary in strength, according to the U.S. National Oceanic and Atmospheric Administration. The last strong El Nino was in 2016.
Because “the impacts of El Nino look a lot like the impacts of global warming,” studying the El Nino economic damage “is pretty essential” to understanding the bigger damage from human-caused climate change, Mankin said. It shows a world unprepared for the hurt that’s coming, he said.
“Our economies are poorly adjusted and poorly adapted to the climate variability that we have right now,” Mankin said.
Neither Mankin nor Callahan are full-time economists. Economists who looked at their study were not impressed, but other climate scientists were.
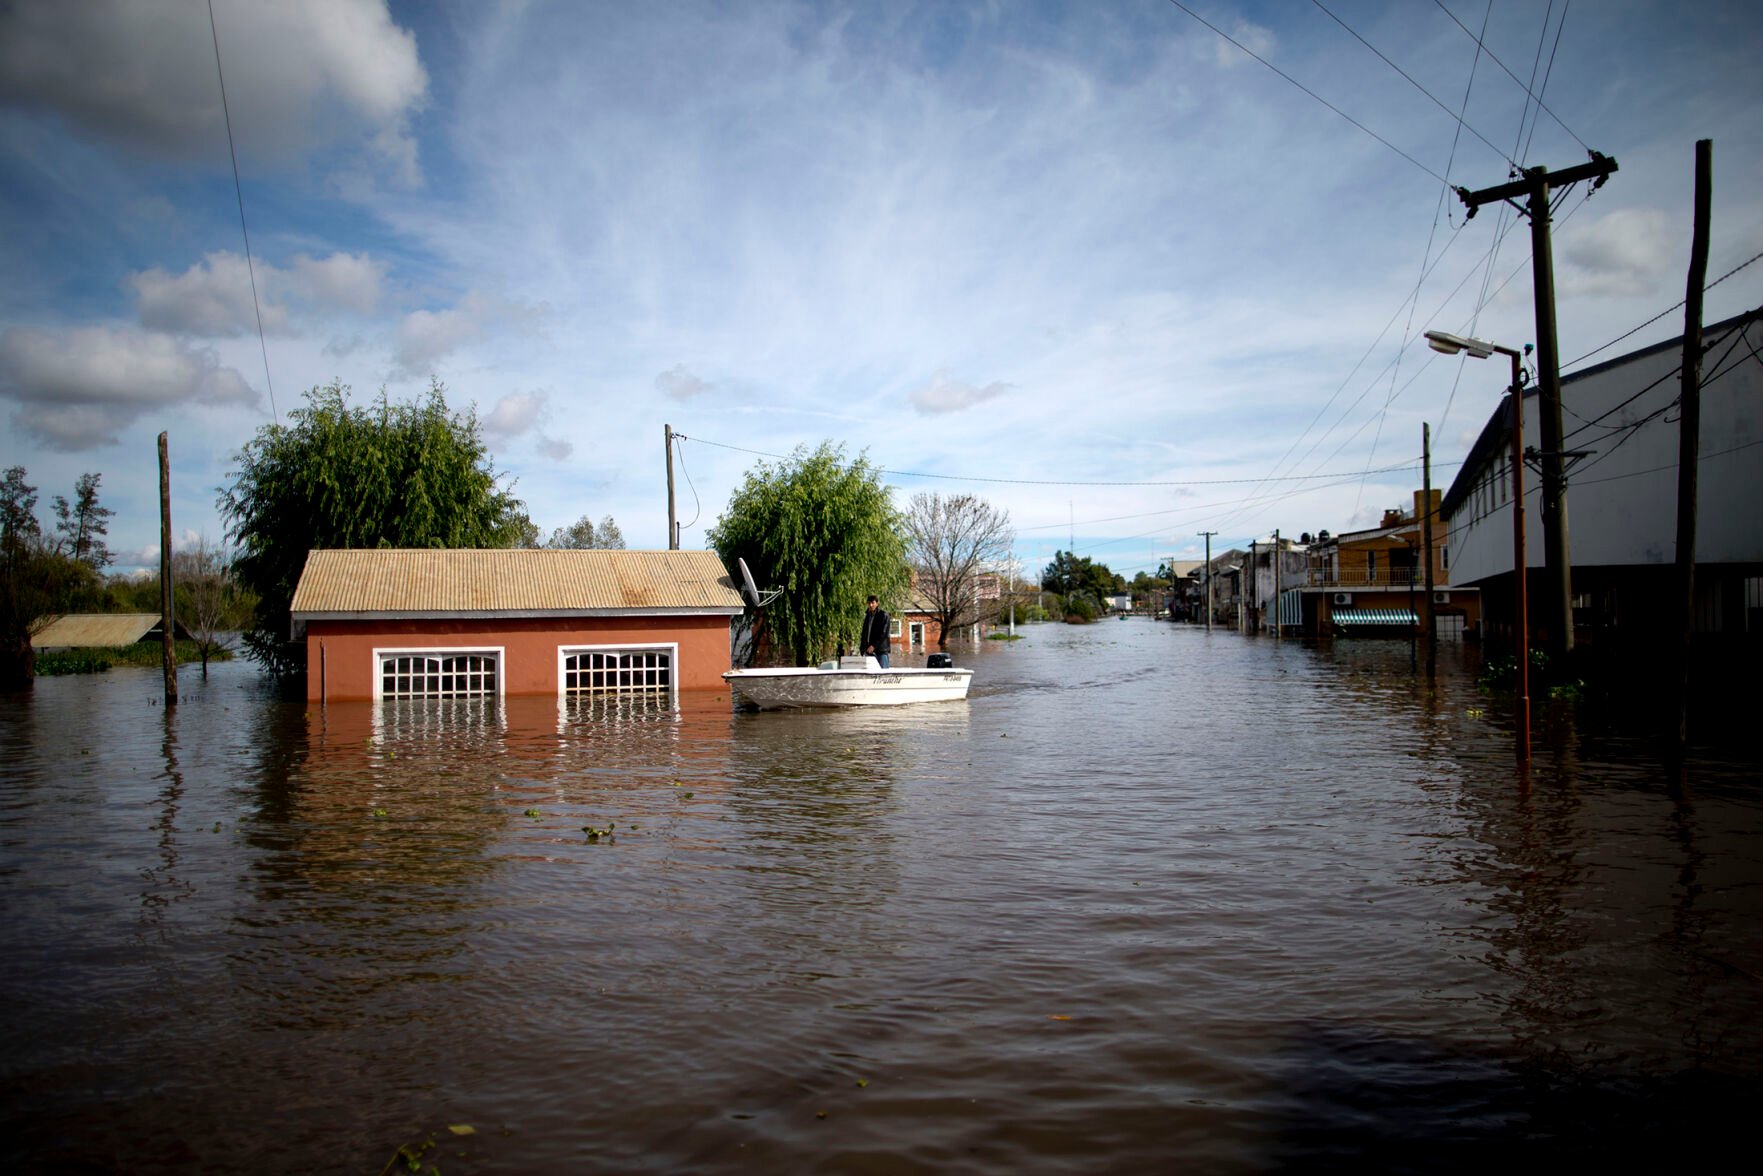
Natacha Pisarenko, Associated Press
Roads are flooded April 28, 2016, in Villa Paranacito, Entre Rios, Argentina.
“It’s not the case that all countries suffer from an El Nino. In fact in some cases it’s just the opposite,” said University of Cambridge macro-economist Kaimar Mohaddes. His 2017 study in the Journal of International Economics looked at 21 national economies, mostly developed, during past El Ninos and found in the United States and Europe an El Nino “has a growth-enhancing effect” while it harmed Australia, Chile, Indonesia, India, Japan, New Zealand and South Africa.
Mankin and Callahan said their study looked at the globe as a whole, not individual countries.
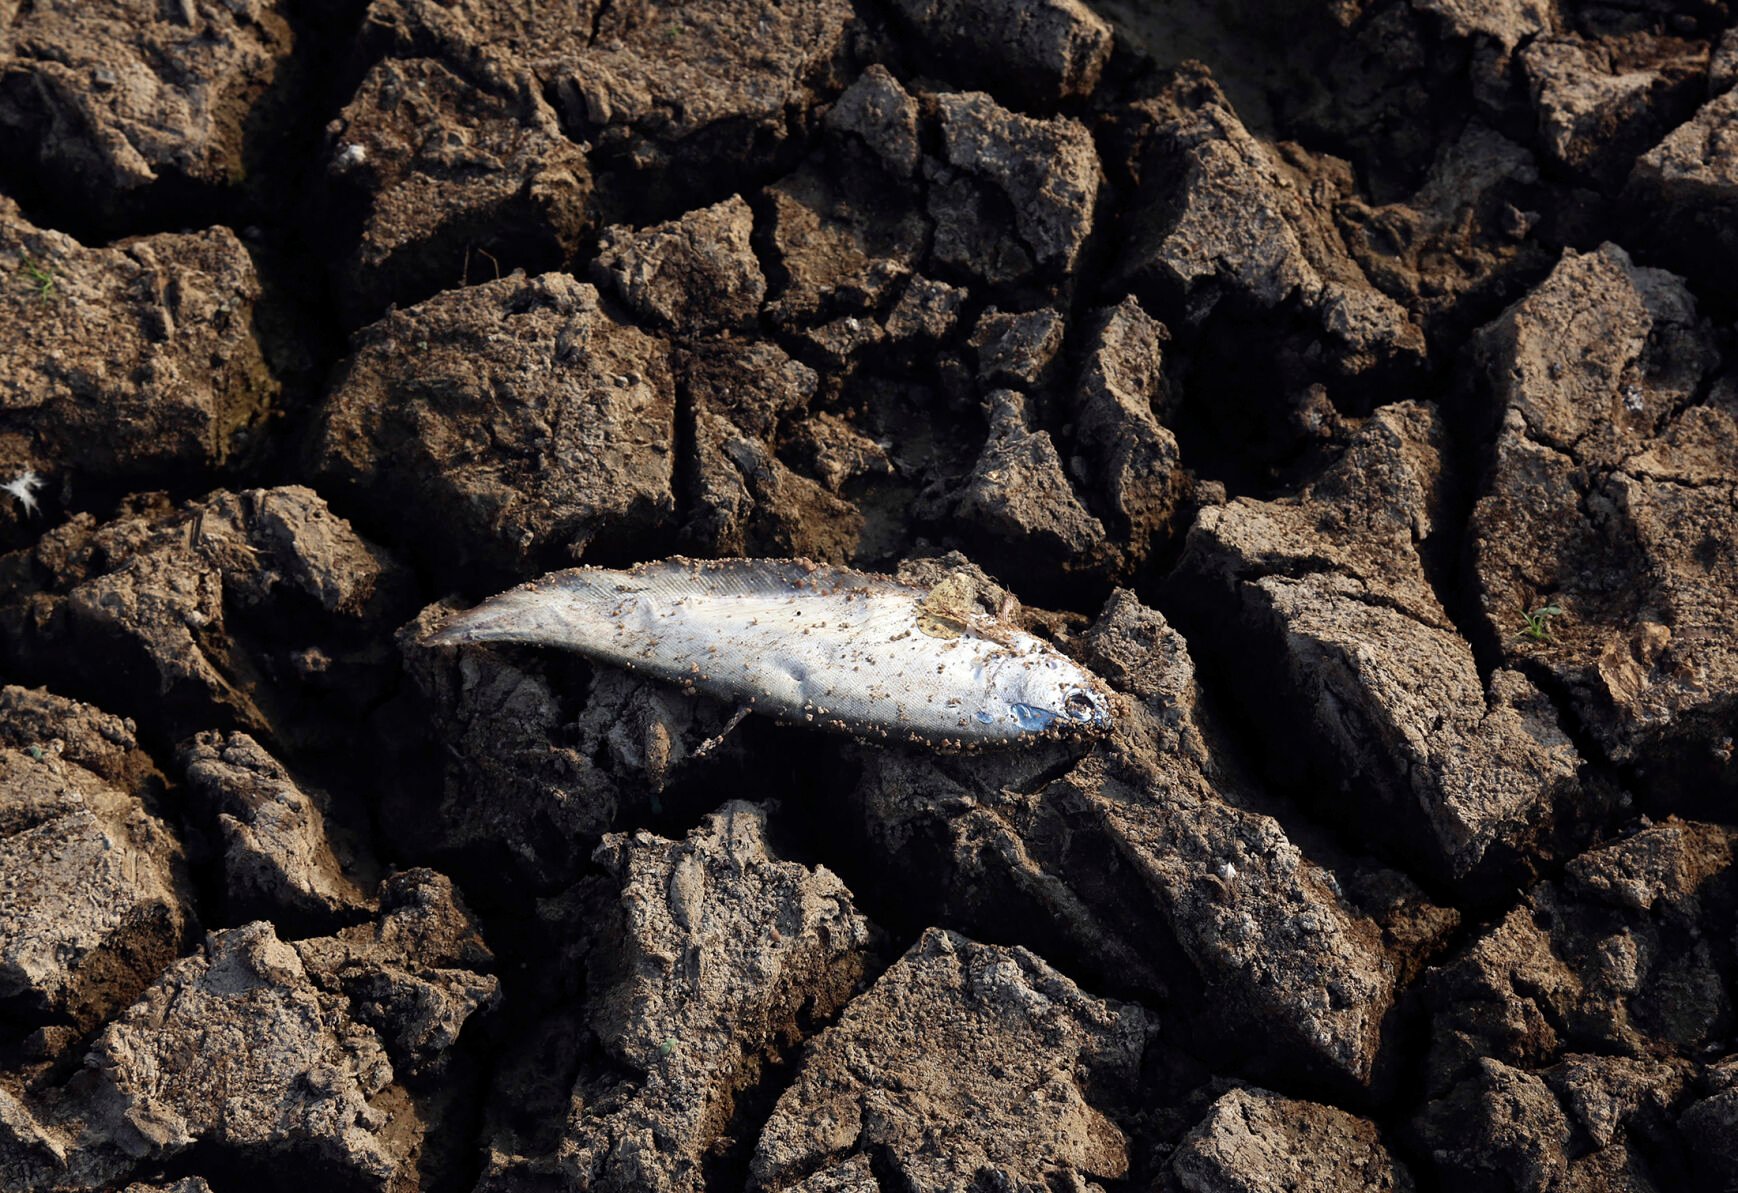
Mahesh Kumar A., Associated Press
A dead fish lies April 21, 2016, on a dried up section of Osman Sagar lake on the outskirts of Hyderabad, India.
Marshall Burke, an economist and environmental policy professor at Stanford University, said the Dartmouth scientists “make a compelling case that this has really slowed growth in severely affected countries like Peru, and resulted in trillions of (dollars) of lost economic output around the world.”
“This paper has certainly made me much more worried about the upcoming and likely large El Nino,” Burke said in an email.
Michael McPhaden, a NOAA oceanographer who studies El Ninos, said he has long thought damage estimates of El Nino were way too low, and more important the “big loser during El Nino is the global south,” which are poorer nations that are hit the hardest.
“The economic impacts of the El Nino that is predicted for later this year will depend on how strong it is,” McPhaden said in an email. Big “monster El Ninos” like those in 1997-98 “can be hugely damaging with lingering effects that carry over into following years. On the other hand, if it turns out to be a garden variety El Nino, the consequences may be more muted and the recovery time shortened.”
-
How the flood risk has changed in each state, according to FEMA
michelmond // Shutterstock
In order to update information about property flood risk, the Federal Emergency Management Administration modified the methodology used in its National Flood Insurance Program evaluations for the first time in 50 years.
Changes in climatic and urban conditions required a rigorous review of the variables taken into account to accurately determine how vulnerable a property is to flood risk. The new costs of insurance policies generated by the national flood insurance system now depend on the results of the latest study, Risk Rating 2.0.
Potential threats have increased for 3.9 million properties out of the 5 million re-diagnosed. Consequently, the cost of insurance premiums was raised, much to the discontent of developers and property owners, especially those in waterfront cities.
The previous methodology tended to overlook the replacement value of any given property, which resulted in inequity for lower-value homes that lay within the same flood plain as higher-value homes. This inequity equated all properties on equal footing for flood risk, with no consideration of the actual value loss for each property, which forced the owners of lower-value homes to purchase insurance packages more costly than was necessary. The new approach now factors in the individual risk for each property or home, which in turn means more valuable—generally waterfront—properties will have their flood insurance premiums rise.
Despite the concern from many high-value homeowners, on a national scale, 86.4% of premiums went up just $10 or less. In 8.6% of cases, the fee increase was somewhere between $10 and $20, while in the remaining 5%, it surpassed the $20 margin. In contrast, the risk rate dropped for 1.2 million properties; as a result, so did the cost of premiums. The revised amount meant a discount of up to $100 for 70.5% of policyholders, while the remaining 29.5% were granted reductions of $50 or more.
Citing the latest data, Stacker dug into how flood insurance premiums will change across every state in the first year of Risk Rating 2.0's implementation. As of April 2022, all policies must follow the new ratings methodology.
You may also like: U.S. cities with the dirtiest air
-
How the flood risk has changed in each state, according to FEMA
Jens Lambert // Shutterstock
52,648 properties with reassessed flood risk
- 11,217 properties with decreased risk
--- 28.9% of monthly flood insurance premiums decreasing $50 or more
--- 71.1% decreasing between $0 and $50
- 41,431 properties with increased risk
--- 88.7% of premiums increasing up to $10
--- 7.2% increasing between $10 and $20
--- 4.1% increasing over $20
-
-
How the flood risk has changed in each state, according to FEMA
Photos BrianScantlebury // Shutterstock
2,250 properties with reassessed flood risk
- 1,932 properties with decreased risk
--- 26.6% of monthly flood insurance premiums decreasing $50 or more
--- 73.4% decreasing between $0 and $50
- 318 properties with increased risk
--- 88.4% of premiums increasing up to $10
--- 7.2% increasing between $10 and $20
--- 4.4% increasing over $20
-
How the flood risk has changed in each state, according to FEMA
You Touch Pix of EuToch // Shutterstock
29,261 properties with reassessed flood risk
- 7,312 properties with decreased risk
--- 40.9% of monthly flood insurance premiums decreasing $50 or more
--- 59.1% decreasing between $0 and $50
- 21,949 properties with increased risk
--- 91.0% of premiums increasing up to $10
--- 6.4% increasing between $10 and $20
--- 2.6% increasing over $20
-
-
How the flood risk has changed in each state, according to FEMA
Sean Pavone // Shutterstock
14,397 properties with reassessed flood risk
- 4,771 properties with decreased risk
--- 43.9% of monthly flood insurance premiums decreasing $50 or more
--- 56.1% decreasing between $0 and $50
- 9,626 properties with increased risk
--- 84.6% of premiums increasing up to $10
--- 9.5% increasing between $10 and $20
--- 5.9% increasing over $20
-
How the flood risk has changed in each state, according to FEMA
Michael Vi // Shutterstock
214,829 properties with reassessed flood risk
- 57,541 properties with decreased risk
--- 38.5% of monthly flood insurance premiums decreasing $50 or more
--- 61.5% decreasing between $0 and $50
- 157,288 properties with increased risk
--- 86.3% of premiums increasing up to $10
--- 8.6% increasing between $10 and $20
--- 5.1% increasing over $20
You may also like: U.S. cities with the cleanest air
-
-
How the flood risk has changed in each state, according to FEMA
marekuliasz // Shutterstock
19,983 properties with reassessed flood risk
- 8,675 properties with decreased risk
--- 30.6% of monthly flood insurance premiums decreasing $50 or more
--- 69.4% decreasing between $0 and $50
- 11,308 properties with increased risk
--- 84.5% of premiums increasing up to $10
--- 8.4% increasing between $10 and $20
--- 7.1% increasing over $20
-
How the flood risk has changed in each state, according to FEMA
Kyle Lee // Shutterstock
34,828 properties with reassessed flood risk
- 12,739 properties with decreased risk
--- 49.5% of monthly flood insurance premiums decreasing $50 or more
--- 50.5% decreasing between $0 and $50
- 22,089 properties with increased risk
--- 73.7% of premiums increasing up to $10
--- 11.9% increasing between $10 and $20
--- 14.3% increasing over $20
-
-
How the flood risk has changed in each state, according to FEMA
Real Window Creative // Shutterstock
26,147 properties with reassessed flood risk
- 9,845 properties with decreased risk
--- 21.7% of monthly flood insurance premiums decreasing $50 or more
--- 78.3% decreasing between $0 and $50
- 16,302 properties with increased risk
--- 83.0% of premiums increasing up to $10
--- 13.4% increasing between $10 and $20
--- 3.5% increasing over $20
-
How the flood risk has changed in each state, according to FEMA
Bilanol // Shutterstock
1.7M properties with reassessed flood risk
- 342,109 properties with decreased risk
--- 13.2% of monthly flood insurance premiums decreasing $50 or more
--- 86.8% decreasing between $0 and $50
- 1.4M properties with increased risk
--- 85.0% of premiums increasing up to $10
--- 9.7% increasing between $10 and $20
--- 5.3% increasing over $20
-
-
How the flood risk has changed in each state, according to FEMA
Gus Valente // Shutterstock
81,998 properties with reassessed flood risk
- 19,929 properties with decreased risk
--- 31.9% of monthly flood insurance premiums decreasing $50 or more
--- 68.1% decreasing between $0 and $50
- 62,069 properties with increased risk
--- 91.3% of premiums increasing up to $10
--- 6.1% increasing between $10 and $20
--- 2.5% increasing over $20
You may also like: 25 endangered animals that only live in America
-
How the flood risk has changed in each state, according to FEMA
Uheheu // Shutterstock
61,382 properties with reassessed flood risk
- 7,924 properties with decreased risk
--- 38.9% of monthly flood insurance premiums decreasing $50 or more
--- 61.1% decreasing between $0 and $50
- 53,458 properties with increased risk
--- 90.0% of premiums increasing up to $10
--- 5.3% increasing between $10 and $20
--- 4.8% increasing over $20
-
-
How the flood risk has changed in each state, according to FEMA
Ric Schafer // Shutterstock
5,645 properties with reassessed flood risk
- 1,580 properties with decreased risk
--- 37.8% of monthly flood insurance premiums decreasing $50 or more
--- 62.2% decreasing between $0 and $50
- 4,065 properties with increased risk
--- 88.2% of premiums increasing up to $10
--- 7.8% increasing between $10 and $20
--- 4.0% increasing over $20
-
How the flood risk has changed in each state, according to FEMA
Jon Rehg // Shutterstock
37,677 properties with reassessed flood risk
- 15,714 properties with decreased risk
--- 43.9% of monthly flood insurance premiums decreasing $50 or more
--- 56.1% decreasing between $0 and $50
- 21,963 properties with increased risk
--- 84.0% of premiums increasing up to $10
--- 9.3% increasing between $10 and $20
--- 6.6% increasing over $20
-
-
How the flood risk has changed in each state, according to FEMA
Tony Campbell // Shutterstock
20,081 properties with reassessed flood risk
- 9,162 properties with decreased risk
--- 48.4% of monthly flood insurance premiums decreasing $50 or more
--- 51.6% decreasing between $0 and $50
- 10,919 properties with increased risk
--- 86.9% of premiums increasing up to $10
--- 8.2% increasing between $10 and $20
--- 4.9% increasing over $20
-
How the flood risk has changed in each state, according to FEMA
Michael Rolands // Shutterstock
12,637 properties with reassessed flood risk
- 4,670 properties with decreased risk
--- 44.3% of monthly flood insurance premiums decreasing $50 or more
--- 55.7% decreasing between $0 and $50
- 7,967 properties with increased risk
--- 82.0% of premiums increasing up to $10
--- 7.8% increasing between $10 and $20
--- 10.2% increasing over $20
You may also like: Major cities with the biggest projected water shortages by 2040
-
-
How the flood risk has changed in each state, according to FEMA
KSwinicki // Shutterstock
9,565 properties with reassessed flood risk
- 3,630 properties with decreased risk
--- 42.3% of monthly flood insurance premiums decreasing $50 or more
--- 57.7% decreasing between $0 and $50
- 5,935 properties with increased risk
--- 90.2% of premiums increasing up to $10
--- 5.0% increasing between $10 and $20
--- 4.8% increasing over $20
-
How the flood risk has changed in each state, according to FEMA
Brymer // Shutterstock
19,361 properties with reassessed flood risk
- 5,523 properties with decreased risk
--- 42.0% of monthly flood insurance premiums decreasing $50 or more
--- 58.0% decreasing between $0 and $50
- 13,838 properties with increased risk
--- 76.3% of premiums increasing up to $10
--- 14.7% increasing between $10 and $20
--- 9.0% increasing over $20
-
-
How the flood risk has changed in each state, according to FEMA
ccpixx photography // Shutterstock
495,923 properties with reassessed flood risk
- 101,171 properties with decreased risk
--- 36.9% of monthly flood insurance premiums decreasing $50 or more
--- 63.1% decreasing between $0 and $50
- 394,752 properties with increased risk
--- 87.0% of premiums increasing up to $10
--- 8.7% increasing between $10 and $20
--- 4.3% increasing over $20
-
How the flood risk has changed in each state, according to FEMA
Arthur Villator // Shutterstock
7,746 properties with reassessed flood risk
- 2,605 properties with decreased risk
--- 35.9% of monthly flood insurance premiums decreasing $50 or more
--- 64.1% decreasing between $0 and $50
- 5,141 properties with increased risk
--- 76.8% of premiums increasing up to $10
--- 9.9% increasing between $10 and $20
--- 13.3% increasing over $20
-
-
How the flood risk has changed in each state, according to FEMA
Jeramey Lende // Shutterstock
64,942 properties with reassessed flood risk
- 39,903 properties with decreased risk
--- 14.3% of monthly flood insurance premiums decreasing $50 or more
--- 85.7% decreasing between $0 and $50
- 25,039 properties with increased risk
--- 92.1% of premiums increasing up to $10
--- 5.4% increasing between $10 and $20
--- 2.4% increasing over $20
You may also like: Beginner's guide to composting
-
How the flood risk has changed in each state, according to FEMA
Keith J Finks // Shutterstock
58,501 properties with reassessed flood risk
- 22,594 properties with decreased risk
--- 45.0% of monthly flood insurance premiums decreasing $50 or more
--- 55.0% decreasing between $0 and $50
- 35,907 properties with increased risk
--- 80.2% of premiums increasing up to $10
--- 9.5% increasing between $10 and $20
--- 10.3% increasing over $20
-
-
How the flood risk has changed in each state, according to FEMA
Pbd1950 // Shutterstock
20,481 properties with reassessed flood risk
- 11,120 properties with decreased risk
--- 43.7% of monthly flood insurance premiums decreasing $50 or more
--- 56.3% decreasing between $0 and $50
- 9,361 properties with increased risk
--- 90.2% of premiums increasing up to $10
--- 6.7% increasing between $10 and $20
--- 3.1% increasing over $20
-
How the flood risk has changed in each state, according to FEMA
Jacob Boomsma // Shutterstock
10,541 properties with reassessed flood risk
- 3,093 properties with decreased risk
--- 38.4% of monthly flood insurance premiums decreasing $50 or more
--- 61.6% decreasing between $0 and $50
- 7,448 properties with increased risk
--- 90.8% of premiums increasing up to $10
--- 5.3% increasing between $10 and $20
--- 3.9% increasing over $20
-
-
How the flood risk has changed in each state, according to FEMA
Chad Robertson Media // Shutterstock
61,317 properties with reassessed flood risk
- 10,047 properties with decreased risk
--- 40.6% of monthly flood insurance premiums decreasing $50 or more
--- 59.4% decreasing between $0 and $50
- 51,270 properties with increased risk
--- 87.1% of premiums increasing up to $10
--- 7.6% increasing between $10 and $20
--- 5.3% increasing over $20
-
How the flood risk has changed in each state, according to FEMA
Gino Santa Maria // Shutterstock
19,706 properties with reassessed flood risk
- 5,839 properties with decreased risk
--- 45.8% of monthly flood insurance premiums decreasing $50 or more
--- 54.2% decreasing between $0 and $50
- 13,867 properties with increased risk
--- 77.3% of premiums increasing up to $10
--- 12.3% increasing between $10 and $20
--- 10.4% increasing over $20
You may also like: Animal species that may become extinct in our lifetime
-
-
How the flood risk has changed in each state, according to FEMA
Jacob Boomsma // Shutterstock
4,339 properties with reassessed flood risk
- 1,617 properties with decreased risk
--- 38.8% of monthly flood insurance premiums decreasing $50 or more
--- 61.2% decreasing between $0 and $50
- 2,722 properties with increased risk
--- 92.3% of premiums increasing up to $10
--- 4.8% increasing between $10 and $20
--- 2.9% increasing over $20
-
How the flood risk has changed in each state, according to FEMA
robert2001 // Shutterstock
9,129 properties with reassessed flood risk
- 3,964 properties with decreased risk
--- 50.1% of monthly flood insurance premiums decreasing $50 or more
--- 49.9% decreasing between $0 and $50
- 5,165 properties with increased risk
--- 80.2% of premiums increasing up to $10
--- 8.1% increasing between $10 and $20
--- 11.7% increasing over $20
-
-
How the flood risk has changed in each state, according to FEMA
Jeffrey J Coleman // Shutterstock
10,586 properties with reassessed flood risk
- 2,196 properties with decreased risk
--- 49.5% of monthly flood insurance premiums decreasing $50 or more
--- 50.5% decreasing between $0 and $50
- 8,390 properties with increased risk
--- 93.1% of premiums increasing up to $10
--- 3.6% increasing between $10 and $20
--- 3.3% increasing over $20
-
How the flood risk has changed in each state, according to FEMA
Sean Pavone // Shutterstock
7,747 properties with reassessed flood risk
- 2,675 properties with decreased risk
--- 36.6% of monthly flood insurance premiums decreasing $50 or more
--- 63.4% decreasing between $0 and $50
- 5,072 properties with increased risk
--- 76.4% of premiums increasing up to $10
--- 13.4% increasing between $10 and $20
--- 10.1% increasing over $20
-
-
How the flood risk has changed in each state, according to FEMA
Tippman98x // Shutterstock
217,178 properties with reassessed flood risk
- 46,318 properties with decreased risk
--- 43.0% of monthly flood insurance premiums decreasing $50 or more
--- 57.0% decreasing between $0 and $50
- 170,860 properties with increased risk
--- 80.3% of premiums increasing up to $10
--- 13.1% increasing between $10 and $20
--- 6.6% increasing over $20
You may also like: Major cities with the biggest projected water shortages by 2040
-
How the flood risk has changed in each state, according to FEMA
gmeland // Shutterstock
11,556 properties with reassessed flood risk
- 4,116 properties with decreased risk
--- 43.6% of monthly flood insurance premiums decreasing $50 or more
--- 56.4% decreasing between $0 and $50
- 7,440 properties with increased risk
--- 86.1% of premiums increasing up to $10
--- 10.5% increasing between $10 and $20
--- 3.4% increasing over $20
-
-
How the flood risk has changed in each state, according to FEMA
Kobby Dagan // Shutterstock
171,099 properties with reassessed flood risk
- 54,008 properties with decreased risk
--- 44.3% of monthly flood insurance premiums decreasing $50 or more
--- 55.7% decreasing between $0 and $50
- 117,091 properties with increased risk
--- 80.1% of premiums increasing up to $10
--- 10.3% increasing between $10 and $20
--- 9.6% increasing over $20
-
How the flood risk has changed in each state, according to FEMA
Jeremy Warner // Shutterstock
139,842 properties with reassessed flood risk
- 35,701 properties with decreased risk
--- 33.2% of monthly flood insurance premiums decreasing $50 or more
--- 66.8% decreasing between $0 and $50
- 104,141 properties with increased risk
--- 88.1% of premiums increasing up to $10
--- 8.1% increasing between $10 and $20
--- 3.7% increasing over $20
-
-
How the flood risk has changed in each state, according to FEMA
John Huntington // Shutterstock
13,161 properties with reassessed flood risk
- 5,020 properties with decreased risk
--- 20.1% of monthly flood insurance premiums decreasing $50 or more
--- 79.9% decreasing between $0 and $50
- 8,141 properties with increased risk
--- 96.1% of premiums increasing up to $10
--- 2.4% increasing between $10 and $20
--- 1.5% increasing over $20
-
How the flood risk has changed in each state, according to FEMA
Bryan Busovicki // Shutterstock
29,044 properties with reassessed flood risk
- 13,074 properties with decreased risk
--- 44.2% of monthly flood insurance premiums decreasing $50 or more
--- 55.8% decreasing between $0 and $50
- 15,970 properties with increased risk
--- 83.0% of premiums increasing up to $10
--- 10.7% increasing between $10 and $20
--- 6.4% increasing over $20
You may also like: How long it takes 50 common items to decompose
-
-
How the flood risk has changed in each state, according to FEMA
Nick Fox // Shutterstock
13,024 properties with reassessed flood risk
- 3,851 properties with decreased risk
--- 46.0% of monthly flood insurance premiums decreasing $50 or more
--- 54.0% decreasing between $0 and $50
- 9,173 properties with increased risk
--- 86.3% of premiums increasing up to $10
--- 7.9% increasing between $10 and $20
--- 5.8% increasing over $20
-
How the flood risk has changed in each state, according to FEMA
Catherine Avilez // Shutterstock
24,850 properties with reassessed flood risk
- 7,511 properties with decreased risk
--- 39.5% of monthly flood insurance premiums decreasing $50 or more
--- 60.5% decreasing between $0 and $50
- 17,339 properties with increased risk
--- 83.1% of premiums increasing up to $10
--- 11.2% increasing between $10 and $20
--- 5.7% increasing over $20
-
-
How the flood risk has changed in each state, according to FEMA
Richard L. Bowman // Shutterstock
51,555 properties with reassessed flood risk
- 15,572 properties with decreased risk
--- 47.6% of monthly flood insurance premiums decreasing $50 or more
--- 52.4% decreasing between $0 and $50
- 35,983 properties with increased risk
--- 79.6% of premiums increasing up to $10
--- 10.7% increasing between $10 and $20
--- 9.7% increasing over $20
-
How the flood risk has changed in each state, according to FEMA
AFP // Getty Images
7,987 properties with reassessed flood risk
- 3,268 properties with decreased risk
--- 38.2% of monthly flood insurance premiums decreasing $50 or more
--- 61.8% decreasing between $0 and $50
- 4,719 properties with increased risk
--- 95.9% of premiums increasing up to $10
--- 1.8% increasing between $10 and $20
--- 2.3% increasing over $20
-
-
How the flood risk has changed in each state, according to FEMA
Olga Enger // Shutterstock
12,001 properties with reassessed flood risk
- 5,520 properties with decreased risk
--- 50.4% of monthly flood insurance premiums decreasing $50 or more
--- 49.6% decreasing between $0 and $50
- 6,481 properties with increased risk
--- 86.6% of premiums increasing up to $10
--- 7.5% increasing between $10 and $20
--- 5.9% increasing over $20
You may also like: Top 10 best and worst foods for the environment
-
How the flood risk has changed in each state, according to FEMA
David AvRutick // Shutterstock
208,559 properties with reassessed flood risk
- 53,213 properties with decreased risk
--- 24.9% of monthly flood insurance premiums decreasing $50 or more
--- 75.1% decreasing between $0 and $50
- 155,346 properties with increased risk
--- 88.6% of premiums increasing up to $10
--- 8.0% increasing between $10 and $20
--- 3.4% increasing over $20
-
-
How the flood risk has changed in each state, according to FEMA
Kid Dog Travel // Shutterstock
3,743 properties with reassessed flood risk
- 1,148 properties with decreased risk
--- 51.4% of monthly flood insurance premiums decreasing $50 or more
--- 48.6% decreasing between $0 and $50
- 2,595 properties with increased risk
--- 86.5% of premiums increasing up to $10
--- 7.4% increasing between $10 and $20
--- 6.1% increasing over $20
-
How the flood risk has changed in each state, according to FEMA
LuckyTenn7 // Shutterstock
27,507 properties with reassessed flood risk
- 7,581 properties with decreased risk
--- 37.6% of monthly flood insurance premiums decreasing $50 or more
--- 62.4% decreasing between $0 and $50
- 19,926 properties with increased risk
--- 81.9% of premiums increasing up to $10
--- 10.9% increasing between $10 and $20
--- 7.2% increasing over $20
-
-
How the flood risk has changed in each state, according to FEMA
michelmond // Shutterstock
768,537 properties with reassessed flood risk
- 106,720 properties with decreased risk
--- 36.5% of monthly flood insurance premiums decreasing $50 or more
--- 63.5% decreasing between $0 and $50
- 661,817 properties with increased risk
--- 91.8% of premiums increasing up to $10
--- 4.9% increasing between $10 and $20
--- 3.2% increasing over $20
-
How the flood risk has changed in each state, according to FEMA
VW Pics // Getty Images
3,755 properties with reassessed flood risk
- 2,006 properties with decreased risk
--- 22.4% of monthly flood insurance premiums decreasing $50 or more
--- 77.6% decreasing between $0 and $50
- 1,749 properties with increased risk
--- 93.1% of premiums increasing up to $10
--- 4.6% increasing between $10 and $20
--- 2.3% increasing over $20
You may also like: States with the worst droughts
-
-
How the flood risk has changed in each state, according to FEMA
Erika J Mitchell // Shutterstock
3,330 properties with reassessed flood risk
- 1,103 properties with decreased risk
--- 55.6% of monthly flood insurance premiums decreasing $50 or more
--- 44.4% decreasing between $0 and $50
- 2,227 properties with increased risk
--- 74.9% of premiums increasing up to $10
--- 13.8% increasing between $10 and $20
--- 11.3% increasing over $20
-
How the flood risk has changed in each state, according to FEMA
Kyle J Little // Shutterstock
104,781 properties with reassessed flood risk
- 46,811 properties with decreased risk
--- 23.2% of monthly flood insurance premiums decreasing $50 or more
--- 76.8% decreasing between $0 and $50
- 57,970 properties with increased risk
--- 87.9% of premiums increasing up to $10
--- 8.8% increasing between $10 and $20
--- 3.3% increasing over $20
-
-
How the flood risk has changed in each state, according to FEMA
Terrence J Allison // Shutterstock
32,547 properties with reassessed flood risk
- 10,717 properties with decreased risk
--- 42.3% of monthly flood insurance premiums decreasing $50 or more
--- 57.7% decreasing between $0 and $50
- 21,830 properties with increased risk
--- 81.9% of premiums increasing up to $10
--- 11.8% increasing between $10 and $20
--- 6.4% increasing over $20
-
How the flood risk has changed in each state, according to FEMA
Sean Pavone // Shutterstock
2,396 properties with reassessed flood risk
- 1,737 properties with decreased risk
--- 10.6% of monthly flood insurance premiums decreasing $50 or more
--- 89.4% decreasing between $0 and $50
- 659 properties with increased risk
--- 88.3% of premiums increasing up to $10
--- 6.4% increasing between $10 and $20
--- 5.3% increasing over $20
-
-
How the flood risk has changed in each state, according to FEMA
Real Window Creative // Shutterstock
13,337 properties with reassessed flood risk
- 2,325 properties with decreased risk
--- 49.5% of monthly flood insurance premiums decreasing $50 or more
--- 50.5% decreasing between $0 and $50
- 11,012 properties with increased risk
--- 72.2% of premiums increasing up to $10
--- 17.6% increasing between $10 and $20
--- 10.2% increasing over $20
You may also like: 25 of the most expensive science experiments in human history
-
How the flood risk has changed in each state, according to FEMA
Aaron of L.A. Photography // Shutterstock
12,949 properties with reassessed flood risk
- 5,669 properties with decreased risk
--- 44.9% of monthly flood insurance premiums decreasing $50 or more
--- 55.1% decreasing between $0 and $50
- 7,280 properties with increased risk
--- 90.5% of premiums increasing up to $10
--- 6.2% increasing between $10 and $20
--- 3.4% increasing over $20
-
-
How the flood risk has changed in each state, according to FEMA
Victoria Ditkovsky // Shutterstock
1,705 properties with reassessed flood risk
- 561 properties with decreased risk
--- 49.2% of monthly flood insurance premiums decreasing $50 or more
--- 50.8% decreasing between $0 and $50
- 1,144 properties with increased risk
--- 88.9% of premiums increasing up to $10
--- 6.6% increasing between $10 and $20
--- 4.5% increasing over $20
