PARIS — Garbage. Heaps, mounds and piles of it are growing daily — and in some places standing higher than a human being.
A strike by Paris garbage collectors is taking a toll on the renowned aesthetics of the French capital, a veritable blight on the City of Light.
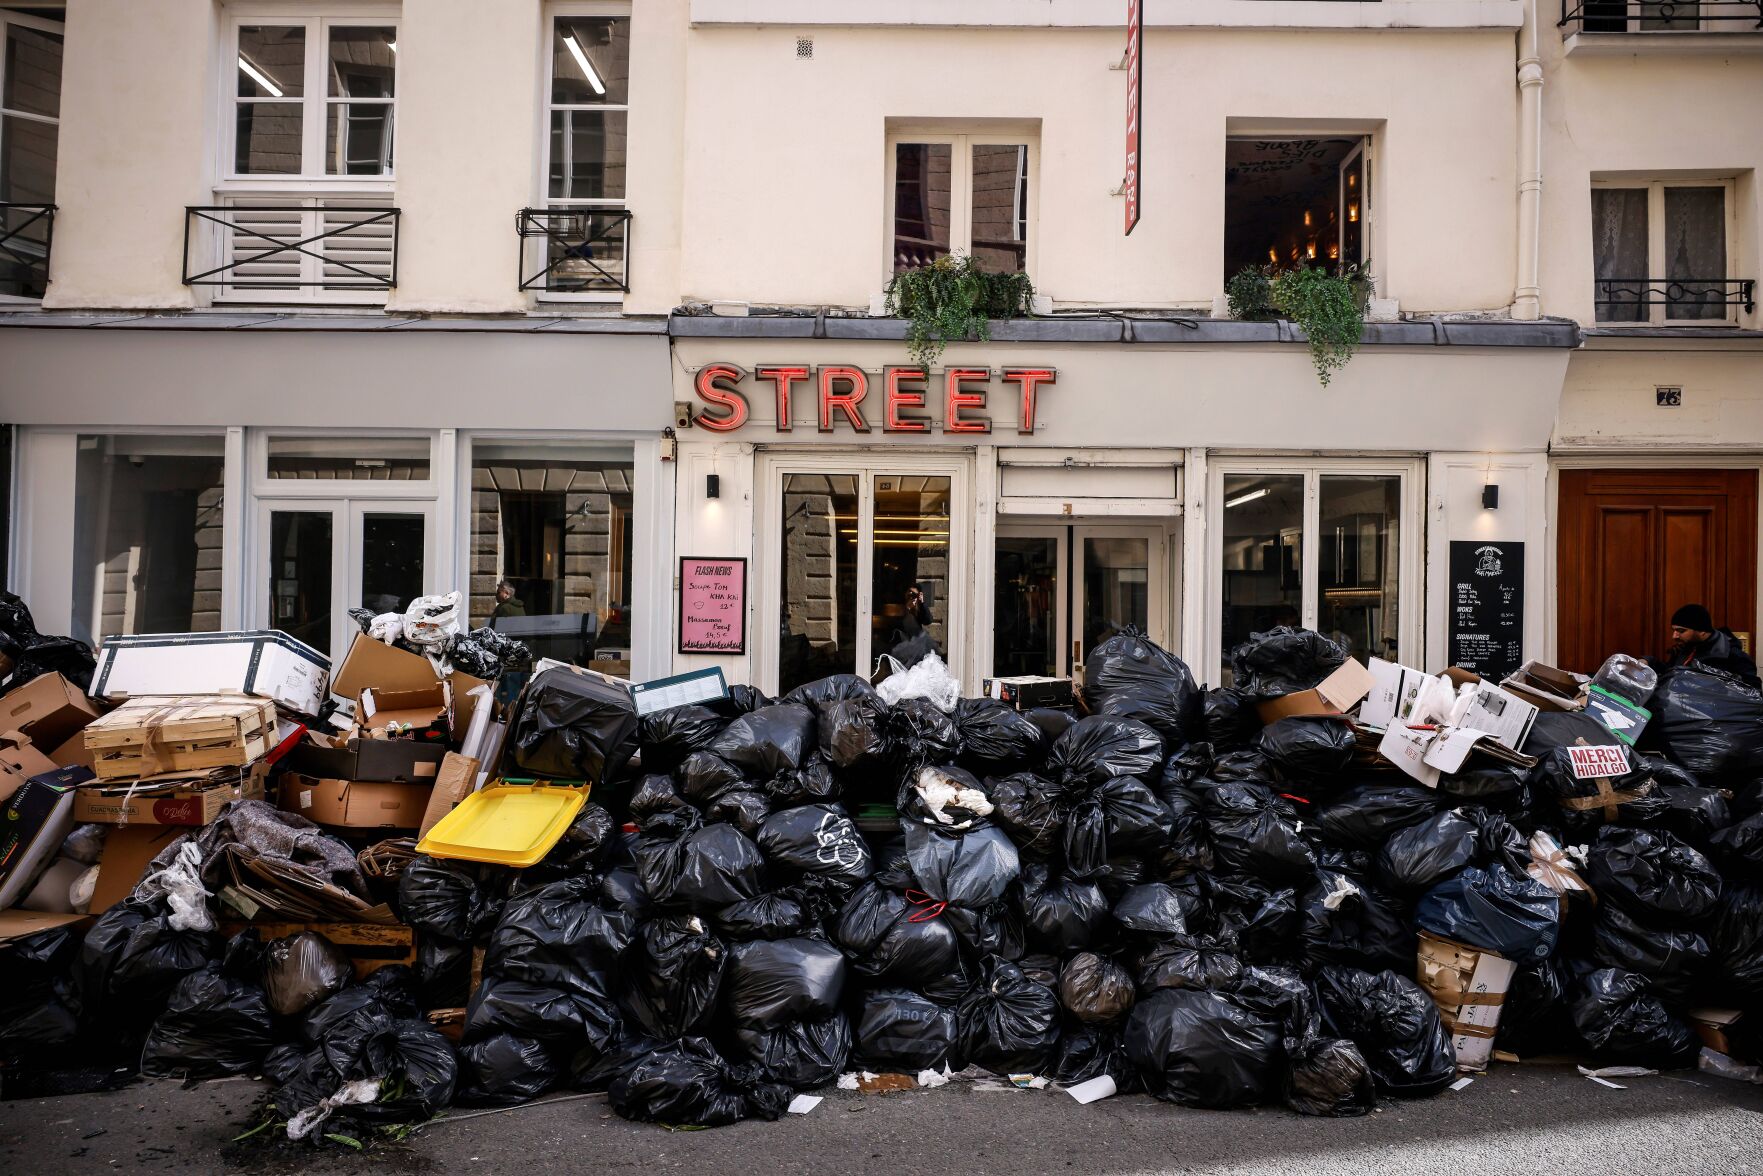
Thomas Padilla, Associated Press
Uncollected garbage is piled up on a street March 15 in Paris during an ongoing strike by sanitation workers.
“I prefer Chanel to the stink,” joked Vincent Salazar, a 62-year-old artistic consultant who lives in a tony Left Bank neighborhood. A pile of garbage sits at the corner of his building overlooking the Luxembourg Gardens.
“I’ve seen rats,” he said.
But like many nonchalant and strike-hardened Parisians, Salazar doesn’t mind.
“I’m fortunate to live here, but I’m 200% behind these guys,” Salazar said. “They’re smelling it all day long,” he said, though “it” wasn’t the word he used. “They should get early retirement.”
He is among the majority of French who, polls show, oppose President Emmanuel Macron’s decision to raise the retirement age by two years, from 62 to 64 for most and from 57 to 59 for garbage collectors.
Macron rammed the showcase legislation of his second term through Parliament last week — without a vote, thanks to a special constitutional article. On Monday, the government won two no-confidence motions put forth by angry lawmakers. The bill is now considered adopted.
But garbage got wrapped up in the politics. And neither unions organizing protests nor some citizens are prepared to back down.
Posters showing a digitally altered images of Macron atop a garbage heap — or collecting garbage himself — have made the rounds on social networks.

Lewis Joly, Associated Press
A protester walks past burning garbage during a protest March 18 in Paris.
The Socialist mayor of Paris, who supports the strikers, found herself in a bind. City Hall refused orders to get the trucks out, saying it’s not their job. Police Chief Laurent Nunez then ordered garages unblocked and ordered 674 sanitation personnel and 206 garbage trucks back to work to provide a minimal service, police tweeted Tuesday.
Sure enough, a green Paris garbage truck was seen collecting a long, high pile of rubbish Tuesday outside a school on a Left Bank street — although the truck was full long before all the refuse could be cleaned up. With incinerators blocked, the garbage was being taken to a storage site outside Paris.
City Hall said that as of Monday, 9,300 tons of rubbish remained on the streets.
Workers in numerous sectors, from transportation to energy, have been holding intermittent strikes since January. But it is the garbage in the French capital that has made garbage collectors, long taken for granted, visible — and their anger obvious.
The city’s vibrant outdoor culture is feeling the effects. Some of Paris’ fabled narrow streets are more choked than usual, forcing people on foot to pass through garbage heaps single file. The scent of rancid, rotting garbage increasingly wafts through the air as spring arrives and the weather grows milder. Seats at some sidewalk cafes located near heaps of rubbish are empty.

Michel Euler, Associated Press
People walk past a pile of garbage near the Eiffel Tower on March 12 in Paris.
A server for the past 26 years at Le Bistro du Dome specializing in fish, next to the famed restaurant Le Dome, said some 50% of diners had disappeared in the past 10 days. Other restaurants are suffering the same fate, said Guillaume, who would identify himself only by his first name.
“It doesn’t bother me because it’s for a good cause,” said Franck Jacquot, 51, standing outside a small bar he runs. Nearby, heaps of garbage loomed. “If we’re obliged to go this route — well, we’re here,” he said.
However, garbage bags and bins have served as fuel for troublemakers.
Two spontaneous protests last week at the huge Place de la Concorde, facing the National Assembly, degenerated when police started evacuating thousands with tear gas and water cannons. Some of those forced out began setting fires to garbage piles along their path through high-end Paris.
That scenario was repeated Monday night when hundreds of young people demonstrated near the gold-domed Invalides monument, site of Napoleon’s tomb. As night fell, small, mobile groups of troublemakers combed the city, burning trash bags, lamp posts and other objects. Nunez, the police chief, speaking on TV news station BFM, said 234 people were detained.
More is ahead: Unions are planning nationwide marches and strikes for Thursday to pressure the government to withdraw the retirement measure.
“Garbage is a good way to protest. It has a big impact,” said Tony Gibierge, 36, who is opening a restaurant in several months on a street in southern Paris — a street currently heaped with garbage.
He was among those who have peacefully demonstrated through Paris, and other cities, with song and dance in recent weeks. “Now we have to send out the fire, stop dancing,” he said. The message: Nothing is over, and much of the garbage isn’t going anywhere quite yet.
-
What 60 years of data tell us about our garbage habits
vchal // Shutterstock
America was built and continues to depend on a culture of consumerism—consumer spending makes up roughly 70% of the United States’ gross domestic product. Nowhere is this insatiable appetite for material things more apparent than in our garbage.
To find out how our trash habits, both individually and as a collective society, have changed over the past 60 years, Pela compiled data from the EPA on municipal waste estimates for various items between 1960 and 2018. For items such as food and yard waste, recycling includes municipal compost disposal.
On individual and collective levels, our generation and treatment of trash reflect our values. Americans generated 292.4 million tons of municipal solid waste in a single year—the equivalent of 4.9 pounds of trash per person per day, according to the most recent EPA data. Roughly 30% of this was recycled. The United States produces more waste per capita than any other country in the world, and among developed nations, it is the only country where waste generation outpaces recycling.
Trash generation in the U.S. has significant global implications. As a byproduct of the 2020 Trade Wars, China is no longer buying and importing America’s trash for recycling. According to the most recent Census data, China was importing an average of 429 shipping containers from the U.S. each day full of plastic alone. When you factor in other types of trash sent overseas, the number of containers jumps to 4,000 daily. In return, the U.S. received exports like aluminum, paper, and more plastic.
America’s trash continues to be exported overseas to Africa and Asia, but now to countries less capable of recycling or disposing of this waste in environmentally conscious ways. It is estimated that 51% of these exports are mismanaged, ending up in oceans, rivers, countrysides, and other natural resources.
Landfills are among the top emitters of methane gasses in the U.S. In 1960, 94% of total American waste ended up in our landfills. Regulatory practices like the 1976 Resource Conservation and Recovery Act and new waste treatment methods brought that number down to 50% in 2018. Some of that can be attributed to better management practices. Recycling and composting rates have increased by about 25 percentage points in the same period.
But it’s not all good news. While disposal methods of combustion and incineration may help alleviate the issue of landfill availability, and while it may also generate electricity, burning trash is significantly contributing to the climate crisis via greenhouse gas emissions. It is a practice facing a reckoning.
In municipalities across the country, particularly low-income areas, it is cheaper to dispose of recyclable trash by landfill or combustion than to recycle it properly, which would require raising taxes for already financially burdened residents.
Individuals alone can no longer solve this problem of excess. And according to a 2020 investigative report by NPR and PBS, when it comes to reducing plastic waste, they never could.
Stakeholders in the plastic industry have knowingly misled consumers about the viability of polymer recycling for decades; in doing so, even more plastic was sold under the promise that a product like a soda bottle will have a long life of reincarnated purpose. This is largely untrue. Polymer recycling is expensive and inefficient. From a business, and more specifically a cost standpoint, it's significantly more advantageous to create virgin plastic instead of recycling what’s already in the trash stream. It is estimated that only 9% of all the plastic ever produced has been recycled with the rest ending up in landfills, incinerated, or polluting natural environments.
Being a conscientious consumer is an important starting point, and there is significant room for improvement. For example, individual consumers are responsible for most food waste generated in the United States, totaling between 30% and 40% of all food produced.
But the most significant share of responsibility to reduce waste falls on corporations worldwide. Just 20 companies create more than half of the world’s single-use plastic waste. Fast fashion brands produce tens of thousands of new lines every year, with most pieces discarded as textile waste. Oil companies are turning to plastic production amid a plastic crisis to buoy their profits. These are just a few examples of a global problem. Keep reading to learn more about how America’s garbage habits have changed since 1960.
-
What 60 years of data tell us about our garbage habits
Siwakorn1933 // Shutterstock
- Total waste generated 2018: 67.4 million tons (+124.7% change since 1960)
- Total sent to landfill: 17.2 million tons (25.6% of total waste generated, -30.9% change since 1960)
- Total recycled: 46.0 million tons (68.2% of total waste generated, +804.9% change since 1960)
- Total combusted: 4.2 million tons (6.2% of total waste generated, increase from 0 tons in 1960)
Paper and paperboard trash are some of the few glimmers of relative success in America’s waste management history. Materials with any type of food or liquid residue or plastic coating—think pizza boxes and milk cartons—cannot be recycled. But the paper products that can be recycled are most often turned into containerboard on their way to becoming cardboard boxes.
Demand for cardboard boxes is at an all-time high, particularly amid the coronavirus pandemic. The cardboard manufacturing industry generated over $67 billion in revenue in the first 10 months of 2020. Corporate giants like Amazon are also reducing paper and paperboard excess in the waste stream. Amazon eliminated the equivalent of 1.6 billion boxes-worth of packaging materials over five years by using artificial intelligence to determine the optimal packaging size.
-
-
What 60 years of data tell us about our garbage habits
Nokwan007 // Shutterstock
- Total waste generated 2018: 12.3 million tons (+82.3% change since 1960)
- Total sent to landfill: 7.6 million tons (61.6% of total waste generated, +14.0% change since 1960)
- Total recycled: 3.1 million tons (25.0% of total waste generated, +2,960.0% change since 1960)
- Total combusted: 1.6 million tons (13.4% of total waste generated, increase from 0 tons in 1960)
Glass has a limitless lifespan: Its quality does not degrade with every melting and reconstituting. But the U.S. is among the worst countries when it comes to glass recycling rates. While many parts of Europe boast rates hovering around 90%, the U.S. has idled about 25% for the last several years.
Like so many other materials on this list, processing glass waste to a satisfactory state for producing cullet—crushed granular glass ultimately used for recycling—is expensive, inefficient, and hard to scale. Since many municipalities utilize single-stream recycling, contamination of materials makes them at best challenging to separate and at worst unusable and bound for landfills. Glass treated with reflective coatings or other materials are not recyclable.
-
What 60 years of data tell us about our garbage habits
Huguette Roe // Shutterstock
- Total waste generated 2018: 19.2 million tons (+86.4% change since 1960)
- Total sent to landfill: 10.5 million tons (54.8% of total waste generated, +2.7% change since 1960)
- Total recycled: 6.4 million tons (33.1% of total waste generated, +12,620.0% change since 1960)
- Total combusted: 2.3 million tons (12.0% of total waste generated, increase from 0 tons in 1960)
Iron and steel constitute the ferrous metals category. An easy way to confirm ferrous vs. non-ferrous is by using a magnet: Ferrous metals will attract it. Some of the most common metal items or metal-containing items in this category that make it into the municipal solid waste stream are furniture, the inner workings of tires, and appliances.
With the increase of homeownership, purchasing power, and various industry expansions over the decades, these types of materials have become more prevalent in our trash. The EPA figures above do not include iron and steel from construction projects and large-scale transportation systems like ships and trucks. Ferrous metals can be recycled indefinitely. Steel and iron are typically less valuable to scrap dealers than various non-ferrous metals.
-
-
What 60 years of data tell us about our garbage habits
cozyta // Shutterstock
- Total waste generated 2018: 3.9 million tons (+1044.1% change since 1960)
- Total sent to landfill: 2.7 million tons (68.4% of total waste generated, +682.4% change since 1960)
- Total recycled: .7 million tons (17.2% of total waste generated, increase from 0 tons in 1960)
- Total combusted: .6 million tons (14.4% of total waste generated, increase from 0 tons in 1960)
Aluminum cans are America’s most successful recycling endeavor, thanks in large part to the Coors family—yes, the beer company. Unlike several materials on this list, recycling aluminum is far more efficient than simply just producing more. Recycling an aluminum can uses just 5% of the energy needed to create it. It can be recycled quickly and indefinitely, and according to the Aluminum Association, 75% of all aluminum ever produced is still in circulation. In 2018, beer and soda cans made up 50% of all the aluminum packaging that was recycled.
-
What 60 years of data tell us about our garbage habits
I AM CONTRIBUTOR // Shutterstock
- Total waste generated 2018: 2.5 million tons (+1294.4% change since 1960)
- Total sent to landfill: .7 million tons (29.5% of total waste generated, +311.1% change since 1960)
- Total recycled: 1.7 million tons (67.3% of total waste generated, increase from 0 tons in 1960)
- Total combusted: .1 million tons (3.2% of total waste generated, increase from 0 tons in 1960)
Lead, copper, and zinc are the most prevalent non-ferrous metals that make it into America’s waste stream and are most often found in the form of car, truck, or motorcycle batteries. Copper is the second-most recycled non-ferrous metal behind aluminum. Like glass, non-ferrous metals can be melted down and repurposed repeatedly without degradation. Consumers can make money by selling scrap metal to local scrap yards who will clean and repurpose the various ores and ensure these materials stay out of landfills.
-
-
What 60 years of data tell us about our garbage habits
jantsarik // Shutterstock
- Total waste generated 2018: 35.7 million tons (+9048.7% change since 1960)
- Total sent to landfill: 27.0 million tons (75.6% of total waste generated, +6815.4% change since 1960)
- Total recycled: 3.1 million tons (8.7% of total waste generated, increase from 0 tons in 1960)
- Total combusted: 5.6 million tons (15.8% of total waste generated, increase from 0 tons in 1960)
Recycling plastic is expensive and labor-intensive. This process is also challenging to scale to the degree that the world needs to reduce plastic waste significantly. With every regeneration of plastic, the material degrades. So, plastic producers have consistently resorted to creating more virgin plastic instead.
A majority of the plastic produced today, including bags, containers, bottles, cutlery, and packaging, is designed to be single-use. These items, used for mere moments, can take anywhere from 10 to 450 years to decompose. Experts anticipate this problem will only get worse. Many large fossil fuel companies like Exxon Mobil predict a decreased demand for oil and natural gas in the near future. To bolster profits, they are investing in the production of plastic, which is, of course, derived from natural gas and crude oil. The World Economic Forum expects plastic production to double by 2040.
-
What 60 years of data tell us about our garbage habits
Zubarev Lexa // Shutterstock
- Total waste generated 2018: 9.2 million tons (+397.8% change since 1960)
- Total sent to landfill: 5.0 million tons (54.5% of total waste generated, +230.5% change since 1960)
- Total recycled: 1.7 million tons (18.2% of total waste generated, +406.1% change since 1960)
- Total combusted: 2.5 million tons (27.3% of total waste generated, increase from 0 tons in 1960)
Automobile tires are the most common rubber waste products. For maximum safety, car, truck, and motorcycle tires are disposed of after the treads are worn down to the point where traction is dangerously reduced. This renders a large portion of the original product, often in good condition, unusable. These worn tires can be recycled into scrap rubber and used to create mulch, agricultural equipment, and various surfaces like rubberized asphalt, playgrounds, and hospital floors.
The increase in rubber waste generated since 1960 can be attributed to greater purchasing power, more people owning cars, and the expanded trucking industry in response to a growing economy. Recycling of scrap tires peaked in 2013 with a 96% recycling rate. Since then, that number has fallen to 76% as innovative applications for recycled rubber have slowed.
-
-
What 60 years of data tell us about our garbage habits
Vitaliy Kyrychuk // Shutterstock
- Total waste generated 2018: 17.0 million tons (+867.6% change since 1960)
- Total sent to landfill: 11.3 million tons (66.4% of total waste generated, +560.8% change since 1960)
- Total recycled: 2.5 million tons (14.7% of total waste generated, +4,920.0% change since 1960)
- Total combusted: 3.2 million tons (18.9% of total waste generated, increase from 0 tons in 1960)
The rise in textile waste can be attributed mainly to the ascent of fast fashion and online shopping. Brands like Zara, H&M, and Fashion Nova are synonymous with cheap and trendy clothing. Fashion Nova releases roughly 1,000 new styles every week. Shein, another famous fast-fashion magnate, releases 1,000 new styles every day. Consumers have come to expect seemingly endless low-cost and on-trend clothing options from retailers. Because these options are produced using cheap materials, they aren’t designed to last. Some brands concerned about exclusivity have even burned unsold merchandise—up to $40 million worth in one case.
Clothing utilization has been declining over the last 20 years, with the average person wearing a garment less than 10 times before being discarded. Recycled clothing is often repurposed into rags and furniture filling or sent overseas.
-
What 60 years of data tell us about our garbage habits
Aurelilus Sapranauskas // Shutterstock
- Total waste generated 2018: 18.1 million tons (+497.0% change since 1960)
- Total sent to landfill: 12.2 million tons (67.2% of total waste generated, +301.0% change since 1960)
- Total recycled: 3.1 million tons (17.1% of total waste generated, increase from 0 tons in 1960)
- Total combusted: 2.8 million tons (15.7% of total waste generated, increase from 0 tons in 1960)
Wood waste in the U.S. consists primarily of shipping pallets, crates, and some furniture. According to the Bureau of Labor Statistics, the price of wood shipping pallets is skyrocketing amid the global supply chain shortage. Industry experts are seeing a shift toward plastic pallets in response to these rising prices. The EPA does not include wood from construction and demolition projects in their municipal solid waste figures. Painted, stained, or chemically treated wood cannot be recycled, but uncontaminated lumber is recycled to make landscaping mulch or pulp for paper.
-
-
What 60 years of data tell us about our garbage habits
Tob1900 // Shutterstock
- Total waste generated 2018: 63.1 million tons (+417.5% change since 1960)
- Total sent to landfill: 35.3 million tons (55.9% of total waste generated, +189.2% change since 1960)
- Total recycled: 2.6 million tons (4.1% of total waste generated, increase from 0 tons in 1960)
- Total combusted: 7.6 million tons (12.0% of total waste generated, increase from 0 tons in 1960)
According to a Natural Resources Defense Council report, individual consumers in America waste 40% of their food annually—the equivalent of 400 pounds of food per person per year. That’s roughly 50% more today than in the 1970s. We have an aversion toward food that looks imperfect, we buy more than we need, are served more than we can or should eat, and lose product at every stop along the supply chain.
As food waste decomposes in landfills, it produces methane, a harmful greenhouse gas that is significantly more potent than carbon dioxide and disastrous to the environment. Food waste is one of the top contributors to methane gas emissions. Initiatives like the Landfill Methane Outreach Program have been working with municipal solid waste stakeholders to reduce and harness the power of methane as an energy source. Limited data exist on the efficacy and long-term impacts of the efforts.
-
What 60 years of data tell us about our garbage habits
7th Son Studio // Shutterstock
- Total waste generated 2018: 35.4 million tons (+77.0% change since 1960)
- Total sent to landfill: 10.5 million tons (29.7% of total waste generated, -47.4% change since 1960)
- Total recycled: 22.3 million tons (63.0% of total waste generated, increase from 0 tons in 1960)
- Total combusted: 2.6 million tons (7.3% of total waste generated, increase from 0 tons in 1960)
Grass, leaves, and tree trimmings from residential and commercial sources comprise the yard trimming municipal solid waste category. Like food waste, yard waste breaks down in landfills and emits methane into the atmosphere. Over the last several decades, many states have banned yard trimmings from being dumped in landfills to reduce greenhouse gas emissions. Recycled yard waste often ends up back in your yard in the form of a soil amendment like compost or mulch.
This story originally appeared on Pela and was produced and distributed in partnership with Stacker Studio.
