Eric Paul Zamora
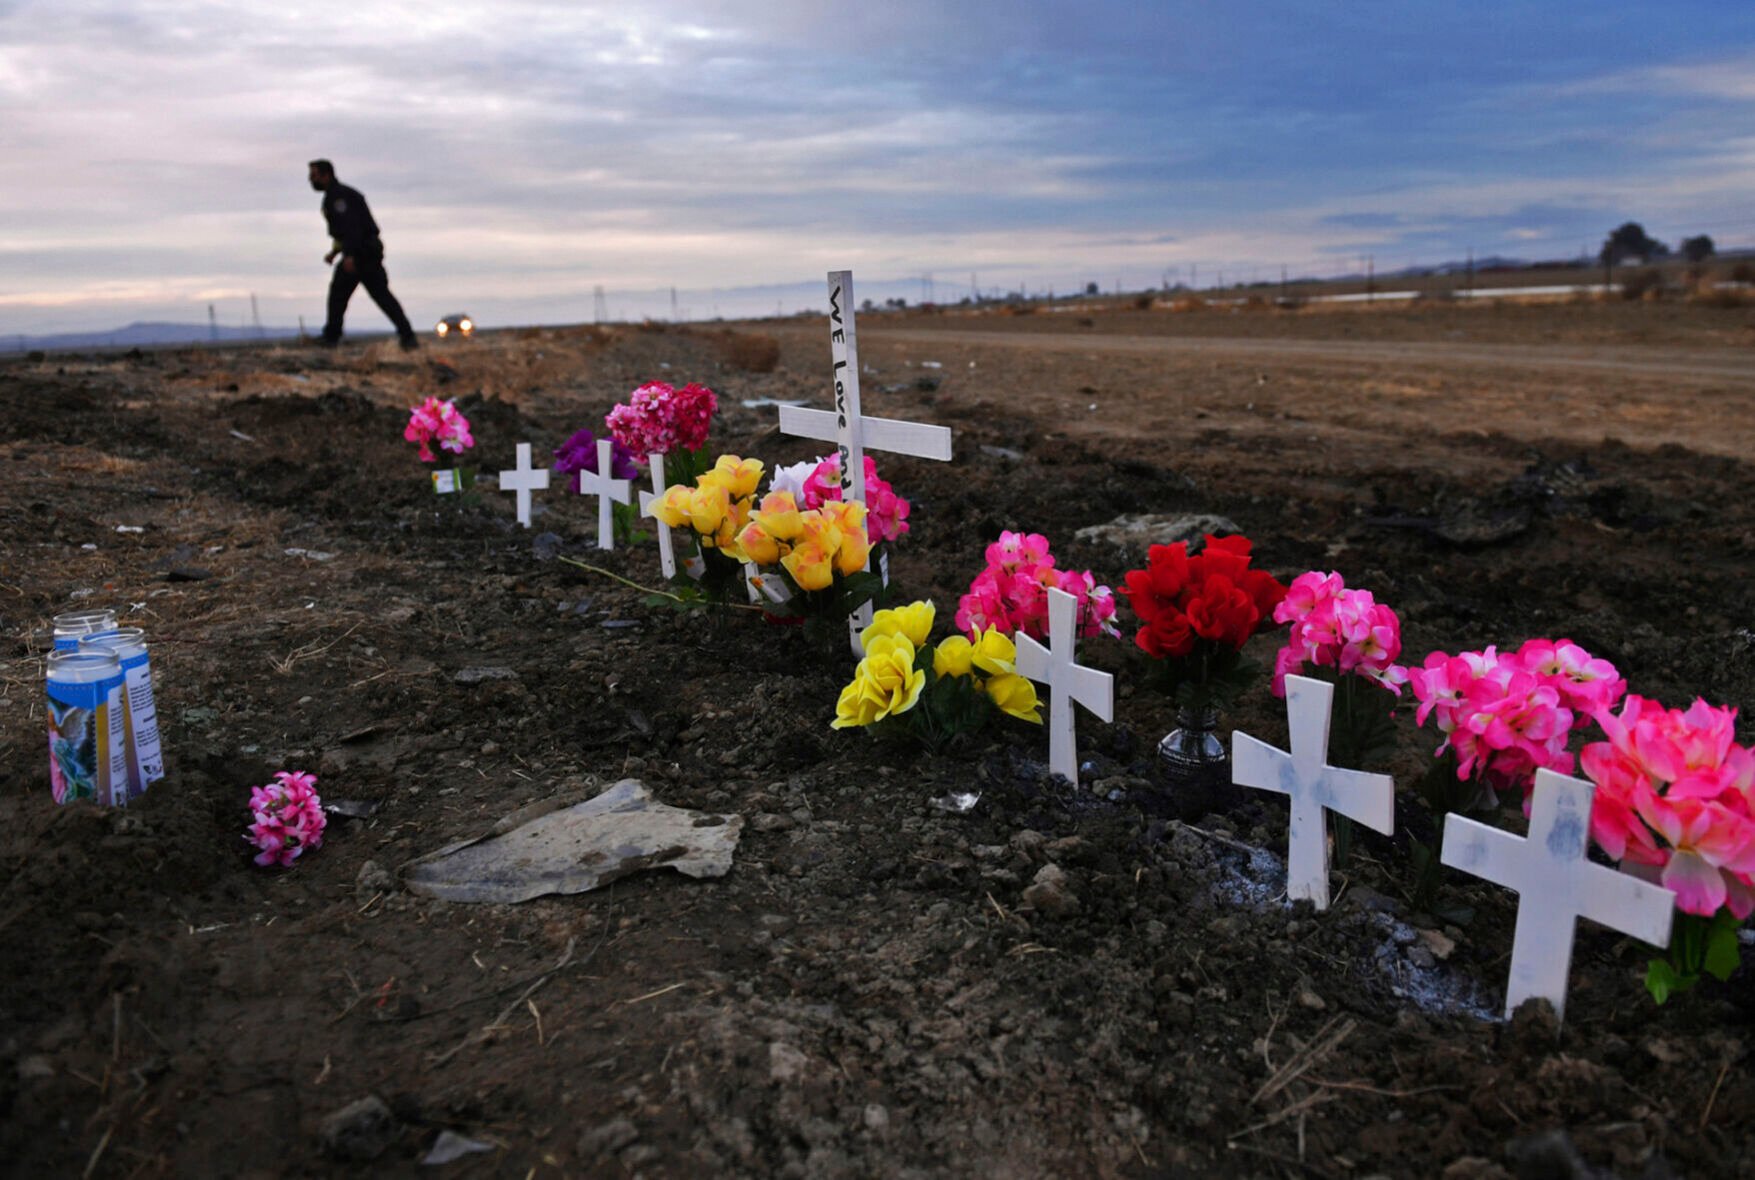
FILE - A row of crosses form a memorial along Highway 33 as police officers survey the scene a day after a crash killed nine people south of Coalinga, Calif., Saturday, Jan. 2, 2021. Investigators said the driver of an SUV involved in the crash was drunk and didn't have a license. The National Transportation Safety Board will use a final report on the crash to launch an effort to lobby for regulations requiring alcohol breath testing devices on all new vehicles. (Eric Paul Zamora/The Fresno Bee via AP)
DETROIT (AP) — The National Transportation Safety Board is recommending that all new vehicles in the U.S. be required to have blood alcohol monitoring systems that can stop an intoxicated person from driving.
The recommendation, if enacted by the National Highway Traffic Safety Administration, could reduce the number of alcohol-related crashes, one of the biggest causes of highway deaths in the U.S.
The new push to make roads safer was included in a report released Tuesday about a horrific crash last year in which a drunk driver collided head-on with another vehicle near Fresno, California, killing both adult drivers and seven children.
NHTSA said this week that roadway deaths in the U.S. are at crisis levels. Nearly 43,000 people were killed last year, the greatest number in 16 years, as Americans returned to roads after pandemic stay-at-home orders.
Early estimates show fatalities rising again through the first half of this year, but they declined from April through June, which authorities are hoping is a trend.
The NTSB, which has no regulatory authority and can only ask other agencies to act, said the recommendation is designed to put pressure on NHTSA to move. It could be effective as early as three years from now.
“We need NHTSA to act. We see the numbers,” NTSB Chairman Jennifer Homendy said. “We need to make sure that we’re doing all we can to save lives.”
The NTSB, she said, has been pushing NHTSA to explore alcohol monitoring technology since 2012. “The faster the technology is implemented the more lives that will be saved,” she said.
The recommendation also calls for systems to monitor a driver’s behavior, making sure they’re alert. She said many cars now have cameras pointed at the driver, which have the potential to limit impaired driving.
But Homendy says she also understands that perfecting the alcohol tests will take time. “We also know that it’s going to take time for NHTSA to evaluate what technologies are available and how to develop a standard.”
A message was left Tuesday seeking comment from NHTSA.

Eric Paul Zamora
FILE - California Highway Patrol Captain Kevin Clays, center, updates the media about Friday's fatal crash on Highway 33 on Saturday, Jan. 2, 2021 in Coalinga, Calif. Investigators said that the driver of an SUV involved in the crash was drunk and didn't have a license. The National Transportation Safety Board will use a final report on the crash to launch an effort to lobby for regulations requiring alcohol breath testing devices on all new vehicles. (Eric Paul Zamora//The Fresno Bee via AP)
The agency and a group of 16 automakers have been jointly funding research on alcohol monitoring since 2008, forming a group called Driver Alcohol Detection System for Safety.
The group has hired a Swedish company to research technology that would automatically test a driver’s breath for alcohol and stop a vehicle from moving if the driver is impaired, said Jake McCook, spokesman for the group. The driver wouldn’t have to blow into a tube, and a sensor would check the driver’s breath, McCook said.
Another company is working on light technology that could test for blood alcohol in a person’s finger, he said. Breath technology could be ready by the end of 2024, while the touch technology would come about a year later.
It could take one or two more model years after automakers get the technology for it to be in new vehicles, McCook said.
Once the technology is ready, it will take years for it to be in most of the roughly 280 million vehicles on U.S. roads.
Under last year’s bipartisan infrastructure law, Congress required NHTSA to make automakers install alcohol monitoring systems within three years. The agency can seek an extension. In the past it has been slow to enact such requirements.
The legislation doesn’t specify the technology, only that it must “passively monitor” a driver to determine if they are impaired.
In 2020, the most recent figures available, 11,654 people died in alcohol-related crashes, according to NHTSA data. That’s about 30% of all U.S. traffic deaths, and a 14% increase over 2019 figures, the last full year before the coronavirus pandemic, the NTSB said.
In the fatal crash included in the report, a 28-year-old driver of an SUV was headed home from a 2021 New Year’s Day party where he had been drinking. The SUV went off the right side of State Route 33, crossed the center line and hit a Ford F-150 pickup truck head-on near Avenal, California.
The pickup was carrying 34-year-old Gabriela Pulido and seven children ages 6 to 15 home after a trip to Pismo Beach. The truck quickly caught fire and bystanders couldn’t save the passengers, the NTSB said.
The SUV driver’s blood alcohol level was 0.21%, nearly three times California’s legal limit. He also had marijuana in his system, but the agency said the alcohol was more than enough to severely impair his driving. The SUV was traveling 88-to-98 miles per hour (142 to 158 kilometers per hour), the report said.
The crash happened less than a second from when the Journey re-entered the road, giving Pulido no time to avoid the collision, the NTSB said.
Juan Pulido, 37, whose wife and four children were killed in the crash, said he’s happy the NTSB is pushing for alcohol monitoring because it could stop another person from losing loved ones. “It’s something that their families have to live with,” he said. “It doesn’t go away tomorrow.”
Pulido’s lawyer, Paul Kiesel, says driver monitoring systems also could stop crashes caused by medical problems or drowsiness, saving anguish and billions in hospital treatment costs.
-
Beer and spirits have more detrimental effects on the waistline, cardiovascular disease risk than wine
cdrin // Shutterstock
Over the last 20 years, a disturbing trend emerged: All 50 states have seen a significant increase in alcohol-related deaths. Only Washington D.C. saw a decrease in death rates.
Besides more obvious alcohol-related deaths like alcohol poisoning or drunk-driving accidents, prolonged heavy alcohol use can cause a range of health problems, which can lead to death. Liver cirrhosis, which develops over years, is a common condition among those who drink heavily. Excessive drinking causes damage to the liver, which causes a buildup of scar tissue, rather than living tissue, in the organ. The effects of cirrhosis are largely irreversible and can lead to liver failure and death.
Alcohol use can also raise the risk of developing cancer. The most common alcohol-related cancers are throat and mouth, liver, esophagus, breast, colon, and rectum. When the body breaks down alcohol, it becomes a chemical called acetaldehyde. This chemical can damage DNA, which can lead to cells growing out of control, resulting in the creation of a tumor. Some alcoholic drinks may also contain carcinogens like asbestos fibers, hydrocarbons, and nitrosamines.
To slow the increasing number of deaths, the CDC created a state funding program to build public health infrastructures aimed at preventing excessive alcohol use. The CDC also partnered with health care networks to improve alcohol screenings and interventions.
To determine how alcohol-related deaths have changed in every state over 20 years, Zinnia Health examined data between 2000 and 2020 from the Centers for Disease Control and Prevention. The CDC considers alcohol-induced deaths as any reported deaths caused by alcohol use—whether dependent or non-dependent—and accidental alcohol poisonings. For every state, 2020 statistics are provided, including the number of alcohol-related deaths, how this figure compares per 100,000 people, the state population that year according to the U.S. Census Bureau, and the 20-year percent change for all three of these statistics.
-
Beer and spirits have more detrimental effects on the waistline, cardiovascular disease risk than wine
Peter Kim // Shutterstock
2020 alcohol-related death stats:
- 569 deaths (up 139.1% from 2000)
- 11.6 deaths per 100,000 people (up 114.8% from 2000)
- 2020 state population: 4,921,532 (up 10.7% from 2000)
Peter Kim // Shutterstock
2020 alcohol-related death stats:
- 569 deaths (up 139.1% from 2000)
- 11.6 deaths per 100,000 people (up 114.8% from 2000)
- 2020 state population: 4,921,532 (up 10.7% from 2000)
-
-
Beer and spirits have more detrimental effects on the waistline, cardiovascular disease risk than wine
Dean Drobot // Shutterstock
2020 alcohol-related death stats:
- 242 deaths (up 137.3% from 2000)
- 33.1 deaths per 100,000 people (up 103.1% from 2000)
- 2020 state population: 731,158 (up 16.6% from 2000)
Dean Drobot // Shutterstock
2020 alcohol-related death stats:
- 242 deaths (up 137.3% from 2000)
- 33.1 deaths per 100,000 people (up 103.1% from 2000)
- 2020 state population: 731,158 (up 16.6% from 2000)
-
Beer and spirits have more detrimental effects on the waistline, cardiovascular disease risk than wine
Pressmaster // Shutterstock
2020 alcohol-related death stats:
- 1,578 deaths (up 234.3% from 2000)
- 21.3 deaths per 100,000 people (up 131.5% from 2000)
- 2020 state population: 7,421,401 (up 44.6% from 2000)
Pressmaster // Shutterstock
2020 alcohol-related death stats:
- 1,578 deaths (up 234.3% from 2000)
- 21.3 deaths per 100,000 people (up 131.5% from 2000)
- 2020 state population: 7,421,401 (up 44.6% from 2000)
-
-
Beer and spirits have more detrimental effects on the waistline, cardiovascular disease risk than wine
gabriel12 // Shutterstock
2020 alcohol-related death stats:
- 382 deaths (up 238.1% from 2000)
- 12.6 deaths per 100,000 people (up 200.0% from 2000)
- 2020 state population: 3,030,522 (up 13.4% from 2000)
gabriel12 // Shutterstock
2020 alcohol-related death stats:
- 382 deaths (up 238.1% from 2000)
- 12.6 deaths per 100,000 people (up 200.0% from 2000)
- 2020 state population: 3,030,522 (up 13.4% from 2000)
-
Beer and spirits have more detrimental effects on the waistline, cardiovascular disease risk than wine
TonelsonProductions // Shutterstock
2020 alcohol-related death stats:
- 6,193 deaths (up 81.8% from 2000)
- 15.7 deaths per 100,000 people (up 55.4% from 2000)
- 2020 state population: 39,368,078 (up 16.2% from 2000)
TonelsonProductions // Shutterstock
2020 alcohol-related death stats:
- 6,193 deaths (up 81.8% from 2000)
- 15.7 deaths per 100,000 people (up 55.4% from 2000)
- 2020 state population: 39,368,078 (up 16.2% from 2000)
-
-
Beer and spirits have more detrimental effects on the waistline, cardiovascular disease risk than wine
Jim Lambert // Shutterstock
2020 alcohol-related death stats:
- 1,568 deaths (up 251.6% from 2000)
- 27.0 deaths per 100,000 people (up 159.6% from 2000)
- 2020 state population: 5,807,719 (up 35.0% from 2000)
Jim Lambert // Shutterstock
2020 alcohol-related death stats:
- 1,568 deaths (up 251.6% from 2000)
- 27.0 deaths per 100,000 people (up 159.6% from 2000)
- 2020 state population: 5,807,719 (up 35.0% from 2000)
-
Beer and spirits have more detrimental effects on the waistline, cardiovascular disease risk than wine
Stuart Monk // Shutterstock
2020 alcohol-related death stats:
- 552 deaths (up 183.1% from 2000)
- 15.5 deaths per 100,000 people (up 171.9% from 2000)
- 2020 state population: 3,557,006 (up 4.4% from 2000)
Stuart Monk // Shutterstock
2020 alcohol-related death stats:
- 552 deaths (up 183.1% from 2000)
- 15.5 deaths per 100,000 people (up 171.9% from 2000)
- 2020 state population: 3,557,006 (up 4.4% from 2000)
-
-
Beer and spirits have more detrimental effects on the waistline, cardiovascular disease risk than wine
Salivanchuk Semen // Shutterstock
2020 alcohol-related death stats:
- 133 deaths (up 160.8% from 2000)
- 13.5 deaths per 100,000 people (up 107.7% from 2000)
- 2020 state population: 986,809 (up 25.9% from 2000)
Salivanchuk Semen // Shutterstock
2020 alcohol-related death stats:
- 133 deaths (up 160.8% from 2000)
- 13.5 deaths per 100,000 people (up 107.7% from 2000)
- 2020 state population: 986,809 (up 25.9% from 2000)
-
Beer and spirits have more detrimental effects on the waistline, cardiovascular disease risk than wine
Jose Luis Stephens // Shutterstock
2020 alcohol-related death stats:
- 3,419 deaths (up 155.0% from 2000)
- 15.7 deaths per 100,000 people (up 86.9% from 2000)
- 2020 state population: 21,733,312 (up 36.0% from 2000)
Jose Luis Stephens // Shutterstock
2020 alcohol-related death stats:
- 3,419 deaths (up 155.0% from 2000)
- 15.7 deaths per 100,000 people (up 86.9% from 2000)
- 2020 state population: 21,733,312 (up 36.0% from 2000)
-
-
Beer and spirits have more detrimental effects on the waistline, cardiovascular disease risk than wine
Billy F Blume Jr // Shutterstock
2020 alcohol-related death stats:
- 1,186 deaths (up 142.5% from 2000)
- 11.1 deaths per 100,000 people (up 85.0% from 2000)
- 2020 state population: 10,710,017 (up 30.8% from 2000)
Billy F Blume Jr // Shutterstock
2020 alcohol-related death stats:
- 1,186 deaths (up 142.5% from 2000)
- 11.1 deaths per 100,000 people (up 85.0% from 2000)
- 2020 state population: 10,710,017 (up 30.8% from 2000)
-
Beer and spirits have more detrimental effects on the waistline, cardiovascular disease risk than wine
Theodore Trimmer // Shutterstock
2020 alcohol-related death stats:
- 131 deaths (up 244.7% from 2000)
- 9.3 deaths per 100,000 people (up 200.0% from 2000)
- 2020 state population: 1,407,006 (up 16.1% from 2000)
Theodore Trimmer // Shutterstock
2020 alcohol-related death stats:
- 131 deaths (up 244.7% from 2000)
- 9.3 deaths per 100,000 people (up 200.0% from 2000)
- 2020 state population: 1,407,006 (up 16.1% from 2000)
-
-
Beer and spirits have more detrimental effects on the waistline, cardiovascular disease risk than wine
George Rudy // Shutterstock
2020 alcohol-related death stats:
- 349 deaths (up 232.4% from 2000)
- 19.1 deaths per 100,000 people (up 135.8% from 2000)
- 2020 state population: 1,826,913 (up 41.2% from 2000)
George Rudy // Shutterstock
2020 alcohol-related death stats:
- 349 deaths (up 232.4% from 2000)
- 19.1 deaths per 100,000 people (up 135.8% from 2000)
- 2020 state population: 1,826,913 (up 41.2% from 2000)
-
Beer and spirits have more detrimental effects on the waistline, cardiovascular disease risk than wine
Saejun Ahn // Shutterstock
2020 alcohol-related death stats:
- 1,543 deaths (up 174.1% from 2000)
- 12.3 deaths per 100,000 people (up 173.3% from 2000)
- 2020 state population: 12,587,530 (up 1.4% from 2000)
Saejun Ahn // Shutterstock
2020 alcohol-related death stats:
- 1,543 deaths (up 174.1% from 2000)
- 12.3 deaths per 100,000 people (up 173.3% from 2000)
- 2020 state population: 12,587,530 (up 1.4% from 2000)
-
-
Beer and spirits have more detrimental effects on the waistline, cardiovascular disease risk than wine
Chris Owens // Shutterstock
2020 alcohol-related death stats:
- 1,027 deaths (up 196.0% from 2000)
- 15.2 deaths per 100,000 people (up 166.7% from 2000)
- 2020 state population: 6,754,953 (up 11.1% from 2000)
Chris Owens // Shutterstock
2020 alcohol-related death stats:
- 1,027 deaths (up 196.0% from 2000)
- 15.2 deaths per 100,000 people (up 166.7% from 2000)
- 2020 state population: 6,754,953 (up 11.1% from 2000)
-
Beer and spirits have more detrimental effects on the waistline, cardiovascular disease risk than wine
Chris Owens // Shutterstock
2020 alcohol-related death stats:
- 524 deaths (up 288.1% from 2000)
- 16.6 deaths per 100,000 people (up 260.9% from 2000)
- 2020 state population: 3,163,561 (up 8.1% from 2000)
Chris Owens // Shutterstock
2020 alcohol-related death stats:
- 524 deaths (up 288.1% from 2000)
- 16.6 deaths per 100,000 people (up 260.9% from 2000)
- 2020 state population: 3,163,561 (up 8.1% from 2000)
-
-
Beer and spirits have more detrimental effects on the waistline, cardiovascular disease risk than wine
Ara Aire // Shutterstock
2020 alcohol-related death stats:
- 489 deaths (up 256.9% from 2000)
- 16.8 deaths per 100,000 people (up 229.4% from 2000)
- 2020 state population: 2,913,805 (up 8.4% from 2000)
Ara Aire // Shutterstock
2020 alcohol-related death stats:
- 489 deaths (up 256.9% from 2000)
- 16.8 deaths per 100,000 people (up 229.4% from 2000)
- 2020 state population: 2,913,805 (up 8.4% from 2000)
-
Beer and spirits have more detrimental effects on the waistline, cardiovascular disease risk than wine
Africa Studio // Shutterstock
2020 alcohol-related death stats:
- 738 deaths (up 180.6% from 2000)
- 16.5 deaths per 100,000 people (up 153.8% from 2000)
- 2020 state population: 4,477,251 (up 10.8% from 2000)
Africa Studio // Shutterstock
2020 alcohol-related death stats:
- 738 deaths (up 180.6% from 2000)
- 16.5 deaths per 100,000 people (up 153.8% from 2000)
- 2020 state population: 4,477,251 (up 10.8% from 2000)
-
-
Beer and spirits have more detrimental effects on the waistline, cardiovascular disease risk than wine
AevanStock // Shutterstock
2020 alcohol-related death stats:
- 443 deaths (up 98.7% from 2000)
- 9.5 deaths per 100,000 people (up 90.0% from 2000)
- 2020 state population: 4,645,318 (up 3.9% from 2000)
AevanStock // Shutterstock
2020 alcohol-related death stats:
- 443 deaths (up 98.7% from 2000)
- 9.5 deaths per 100,000 people (up 90.0% from 2000)
- 2020 state population: 4,645,318 (up 3.9% from 2000)
-
Beer and spirits have more detrimental effects on the waistline, cardiovascular disease risk than wine
Alexey Andr Tkachenko // Shutterstock
2020 alcohol-related death stats:
- 286 deaths (up 194.8% from 2000)
- 21.2 deaths per 100,000 people (up 178.9% from 2000)
- 2020 state population: 1,350,141 (up 5.9% from 2000)
Alexey Andr Tkachenko // Shutterstock
2020 alcohol-related death stats:
- 286 deaths (up 194.8% from 2000)
- 21.2 deaths per 100,000 people (up 178.9% from 2000)
- 2020 state population: 1,350,141 (up 5.9% from 2000)
-
-
Beer and spirits have more detrimental effects on the waistline, cardiovascular disease risk than wine
Salivanchuk Semen // Shutterstock
2020 alcohol-related death stats:
- 600 deaths (up 104.1% from 2000)
- 9.9 deaths per 100,000 people (up 76.8% from 2000)
- 2020 state population: 6,055,802 (up 14.3% from 2000)
Salivanchuk Semen // Shutterstock
2020 alcohol-related death stats:
- 600 deaths (up 104.1% from 2000)
- 9.9 deaths per 100,000 people (up 76.8% from 2000)
- 2020 state population: 6,055,802 (up 14.3% from 2000)
-
Beer and spirits have more detrimental effects on the waistline, cardiovascular disease risk than wine
QualityHD // Shutterstock
2020 alcohol-related death stats:
- 1,006 deaths (up 195.0% from 2000)
- 14.6 deaths per 100,000 people (up 170.4% from 2000)
- 2020 state population: 6,893,574 (up 8.6% from 2000)
QualityHD // Shutterstock
2020 alcohol-related death stats:
- 1,006 deaths (up 195.0% from 2000)
- 14.6 deaths per 100,000 people (up 170.4% from 2000)
- 2020 state population: 6,893,574 (up 8.6% from 2000)
-
-
Beer and spirits have more detrimental effects on the waistline, cardiovascular disease risk than wine
VisualArtStudio // Shutterstock
2020 alcohol-related death stats:
- 1,610 deaths (up 137.1% from 2000)
- 16.2 deaths per 100,000 people (up 138.2% from 2000)
- 2020 state population: 9,966,555 (up 0.3% from 2000)
VisualArtStudio // Shutterstock
2020 alcohol-related death stats:
- 1,610 deaths (up 137.1% from 2000)
- 16.2 deaths per 100,000 people (up 138.2% from 2000)
- 2020 state population: 9,966,555 (up 0.3% from 2000)
-
Beer and spirits have more detrimental effects on the waistline, cardiovascular disease risk than wine
Sam Wagner // Shutterstock
2020 alcohol-related death stats:
- 1,065 deaths (up 232.8% from 2000)
- 18.8 deaths per 100,000 people (up 189.2% from 2000)
- 2020 state population: 5,657,342 (up 15.0% from 2000)
Sam Wagner // Shutterstock
2020 alcohol-related death stats:
- 1,065 deaths (up 232.8% from 2000)
- 18.8 deaths per 100,000 people (up 189.2% from 2000)
- 2020 state population: 5,657,342 (up 15.0% from 2000)
-
-
Beer and spirits have more detrimental effects on the waistline, cardiovascular disease risk than wine
jmanaugh3 // Shutterstock
2020 alcohol-related death stats:
- 395 deaths (up 135.1% from 2000)
- 13.3 deaths per 100,000 people (up 125.4% from 2000)
- 2020 state population: 2,966,786 (up 4.3% from 2000)
jmanaugh3 // Shutterstock
2020 alcohol-related death stats:
- 395 deaths (up 135.1% from 2000)
- 13.3 deaths per 100,000 people (up 125.4% from 2000)
- 2020 state population: 2,966,786 (up 4.3% from 2000)
-
Beer and spirits have more detrimental effects on the waistline, cardiovascular disease risk than wine
APN Photography // Shutterstock
2020 alcohol-related death stats:
- 791 deaths (up 141.2% from 2000)
- 12.9 deaths per 100,000 people (up 118.6% from 2000)
- 2020 state population: 6,151,548 (up 9.9% from 2000)
APN Photography // Shutterstock
2020 alcohol-related death stats:
- 791 deaths (up 141.2% from 2000)
- 12.9 deaths per 100,000 people (up 118.6% from 2000)
- 2020 state population: 6,151,548 (up 9.9% from 2000)
-
-
Beer and spirits have more detrimental effects on the waistline, cardiovascular disease risk than wine
melissamn // Shutterstock
2020 alcohol-related death stats:
- 299 deaths (up 273.8% from 2000)
- 27.7 deaths per 100,000 people (up 211.2% from 2000)
- 2020 state population: 1,080,577 (up 19.8% from 2000)
melissamn // Shutterstock
2020 alcohol-related death stats:
- 299 deaths (up 273.8% from 2000)
- 27.7 deaths per 100,000 people (up 211.2% from 2000)
- 2020 state population: 1,080,577 (up 19.8% from 2000)
-
Beer and spirits have more detrimental effects on the waistline, cardiovascular disease risk than wine
thanosquest // Shutterstock
2020 alcohol-related death stats:
- 383 deaths (up 447.1% from 2000)
- 19.8 deaths per 100,000 people (up 382.9% from 2000)
- 2020 state population: 1,937,552 (up 13.2% from 2000)
thanosquest // Shutterstock
2020 alcohol-related death stats:
- 383 deaths (up 447.1% from 2000)
- 19.8 deaths per 100,000 people (up 382.9% from 2000)
- 2020 state population: 1,937,552 (up 13.2% from 2000)
-
-
Beer and spirits have more detrimental effects on the waistline, cardiovascular disease risk than wine
Marcel Kriegl // Shutterstock
2020 alcohol-related death stats:
- 714 deaths (up 229.0% from 2000)
- 22.8 deaths per 100,000 people (up 109.2% from 2000)
- 2020 state population: 3,138,259 (up 57.0% from 2000)
Marcel Kriegl // Shutterstock
2020 alcohol-related death stats:
- 714 deaths (up 229.0% from 2000)
- 22.8 deaths per 100,000 people (up 109.2% from 2000)
- 2020 state population: 3,138,259 (up 57.0% from 2000)
-
Beer and spirits have more detrimental effects on the waistline, cardiovascular disease risk than wine
Kondor83 // Shutterstock
2020 alcohol-related death stats:
- 226 deaths (up 148.4% from 2000)
- 16.5 deaths per 100,000 people (up 123.0% from 2000)
- 2020 state population: 1,366,275 (up 10.6% from 2000)
Kondor83 // Shutterstock
2020 alcohol-related death stats:
- 226 deaths (up 148.4% from 2000)
- 16.5 deaths per 100,000 people (up 123.0% from 2000)
- 2020 state population: 1,366,275 (up 10.6% from 2000)
-
-
Beer and spirits have more detrimental effects on the waistline, cardiovascular disease risk than wine
Hector Rivera // Shutterstock
2020 alcohol-related death stats:
- 861 deaths (up 68.8% from 2000)
- 9.7 deaths per 100,000 people (up 59.0% from 2000)
- 2020 state population: 8,882,371 (up 5.6% from 2000)
Hector Rivera // Shutterstock
2020 alcohol-related death stats:
- 861 deaths (up 68.8% from 2000)
- 9.7 deaths per 100,000 people (up 59.0% from 2000)
- 2020 state population: 8,882,371 (up 5.6% from 2000)
-
Beer and spirits have more detrimental effects on the waistline, cardiovascular disease risk than wine
TFoxFoto // Shutterstock
2020 alcohol-related death stats:
- 925 deaths (up 170.5% from 2000)
- 43.9 deaths per 100,000 people (up 133.5% from 2000)
- 2020 state population: 2,106,319 (up 15.8% from 2000)
TFoxFoto // Shutterstock
2020 alcohol-related death stats:
- 925 deaths (up 170.5% from 2000)
- 43.9 deaths per 100,000 people (up 133.5% from 2000)
- 2020 state population: 2,106,319 (up 15.8% from 2000)
-
-
Beer and spirits have more detrimental effects on the waistline, cardiovascular disease risk than wine
Cabeca de Marmore // Shutterstock
2020 alcohol-related death stats:
- 1,883 deaths (up 62.5% from 2000)
- 9.7 deaths per 100,000 people (up 59.0% from 2000)
- 2020 state population: 19,336,776 (up 1.9% from 2000)
Cabeca de Marmore // Shutterstock
2020 alcohol-related death stats:
- 1,883 deaths (up 62.5% from 2000)
- 9.7 deaths per 100,000 people (up 59.0% from 2000)
- 2020 state population: 19,336,776 (up 1.9% from 2000)
-
Beer and spirits have more detrimental effects on the waistline, cardiovascular disease risk than wine
mavo // Shutterstock
2020 alcohol-related death stats:
- 1,392 deaths (up 100.3% from 2000)
- 13.1 deaths per 100,000 people (up 52.3% from 2000)
- 2020 state population: 10,600,823 (up 31.7% from 2000)
mavo // Shutterstock
2020 alcohol-related death stats:
- 1,392 deaths (up 100.3% from 2000)
- 13.1 deaths per 100,000 people (up 52.3% from 2000)
- 2020 state population: 10,600,823 (up 31.7% from 2000)
-
-
Beer and spirits have more detrimental effects on the waistline, cardiovascular disease risk than wine
Thitinun Lerdkijsakul // Shutterstock
2020 alcohol-related death stats:
- 178 deaths (up 263.3% from 2000)
- 23.3 deaths per 100,000 people (up 206.6% from 2000)
- 2020 state population: 765,309 (up 19.2% from 2000)
Thitinun Lerdkijsakul // Shutterstock
2020 alcohol-related death stats:
- 178 deaths (up 263.3% from 2000)
- 23.3 deaths per 100,000 people (up 206.6% from 2000)
- 2020 state population: 765,309 (up 19.2% from 2000)
-
Beer and spirits have more detrimental effects on the waistline, cardiovascular disease risk than wine
bogdanhoda // Shutterstock
2020 alcohol-related death stats:
- 1,599 deaths (up 173.3% from 2000)
- 13.7 deaths per 100,000 people (up 163.5% from 2000)
- 2020 state population: 11,693,217 (up 3.0% from 2000)
bogdanhoda // Shutterstock
2020 alcohol-related death stats:
- 1,599 deaths (up 173.3% from 2000)
- 13.7 deaths per 100,000 people (up 163.5% from 2000)
- 2020 state population: 11,693,217 (up 3.0% from 2000)
-
-
Beer and spirits have more detrimental effects on the waistline, cardiovascular disease risk than wine
Wirestock Creators // Shutterstock
2020 alcohol-related death stats:
- 737 deaths (up 216.3% from 2000)
- 18.5 deaths per 100,000 people (up 172.1% from 2000)
- 2020 state population: 3,980,783 (up 15.4% from 2000)
Wirestock Creators // Shutterstock
2020 alcohol-related death stats:
- 737 deaths (up 216.3% from 2000)
- 18.5 deaths per 100,000 people (up 172.1% from 2000)
- 2020 state population: 3,980,783 (up 15.4% from 2000)
-
Beer and spirits have more detrimental effects on the waistline, cardiovascular disease risk than wine
Chris Owens // Shutterstock
2020 alcohol-related death stats:
- 1,134 deaths (up 263.5% from 2000)
- 26.7 deaths per 100,000 people (up 193.4% from 2000)
- 2020 state population: 4,241,507 (up 24.0% from 2000)
Chris Owens // Shutterstock
2020 alcohol-related death stats:
- 1,134 deaths (up 263.5% from 2000)
- 26.7 deaths per 100,000 people (up 193.4% from 2000)
- 2020 state population: 4,241,507 (up 24.0% from 2000)
-
-
Beer and spirits have more detrimental effects on the waistline, cardiovascular disease risk than wine
Tim Roberts Photography // Shutterstock
2020 alcohol-related death stats:
- 1,272 deaths (up 170.1% from 2000)
- 10.0 deaths per 100,000 people (up 163.2% from 2000)
- 2020 state population: 12,783,254 (up 4.1% from 2000)
Tim Roberts Photography // Shutterstock
2020 alcohol-related death stats:
- 1,272 deaths (up 170.1% from 2000)
- 10.0 deaths per 100,000 people (up 163.2% from 2000)
- 2020 state population: 12,783,254 (up 4.1% from 2000)
-
Beer and spirits have more detrimental effects on the waistline, cardiovascular disease risk than wine
D Guest Smith // Shutterstock
2020 alcohol-related death stats:
- 205 deaths (up 166.2% from 2000)
- 19.4 deaths per 100,000 people (up 165.8% from 2000)
- 2020 state population: 1,057,125 (up 0.8% from 2000)
D Guest Smith // Shutterstock
2020 alcohol-related death stats:
- 205 deaths (up 166.2% from 2000)
- 19.4 deaths per 100,000 people (up 165.8% from 2000)
- 2020 state population: 1,057,125 (up 0.8% from 2000)
-
-
Beer and spirits have more detrimental effects on the waistline, cardiovascular disease risk than wine
J.D.S // Shutterstock
2020 alcohol-related death stats:
- 878 deaths (up 90.5% from 2000)
- 16.8 deaths per 100,000 people (up 46.1% from 2000)
- 2020 state population: 5,218,040 (up 30.1% from 2000)
J.D.S // Shutterstock
2020 alcohol-related death stats:
- 878 deaths (up 90.5% from 2000)
- 16.8 deaths per 100,000 people (up 46.1% from 2000)
- 2020 state population: 5,218,040 (up 30.1% from 2000)
-
Beer and spirits have more detrimental effects on the waistline, cardiovascular disease risk than wine
Paul R. Jones // Shutterstock
2020 alcohol-related death stats:
- 271 deaths (up 292.8% from 2000)
- 30.4 deaths per 100,000 people (up 234.1% from 2000)
- 2020 state population: 892,717 (up 18.3% from 2000)
Paul R. Jones // Shutterstock
2020 alcohol-related death stats:
- 271 deaths (up 292.8% from 2000)
- 30.4 deaths per 100,000 people (up 234.1% from 2000)
- 2020 state population: 892,717 (up 18.3% from 2000)
-
-
Beer and spirits have more detrimental effects on the waistline, cardiovascular disease risk than wine
f11photo // Shutterstock
2020 alcohol-related death stats:
- 1,250 deaths (up 221.3% from 2000)
- 18.2 deaths per 100,000 people (up 167.6% from 2000)
- 2020 state population: 6,886,834 (up 21.0% from 2000)
f11photo // Shutterstock
2020 alcohol-related death stats:
- 1,250 deaths (up 221.3% from 2000)
- 18.2 deaths per 100,000 people (up 167.6% from 2000)
- 2020 state population: 6,886,834 (up 21.0% from 2000)
-
Beer and spirits have more detrimental effects on the waistline, cardiovascular disease risk than wine
Victor Jiang // Shutterstock
2020 alcohol-related death stats:
- 3,298 deaths (up 176.9% from 2000)
- 11.2 deaths per 100,000 people (up 96.5% from 2000)
- 2020 state population: 29,360,759 (up 40.8% from 2000)
Victor Jiang // Shutterstock
2020 alcohol-related death stats:
- 3,298 deaths (up 176.9% from 2000)
- 11.2 deaths per 100,000 people (up 96.5% from 2000)
- 2020 state population: 29,360,759 (up 40.8% from 2000)
-
-
Beer and spirits have more detrimental effects on the waistline, cardiovascular disease risk than wine
Working Title Productions // Shutterstock
2020 alcohol-related death stats:
- 414 deaths (up 266.4% from 2000)
- 12.7 deaths per 100,000 people (up 149.0% from 2000)
- 2020 state population: 3,249,879 (up 45.5% from 2000)
Working Title Productions // Shutterstock
2020 alcohol-related death stats:
- 414 deaths (up 266.4% from 2000)
- 12.7 deaths per 100,000 people (up 149.0% from 2000)
- 2020 state population: 3,249,879 (up 45.5% from 2000)
-
Beer and spirits have more detrimental effects on the waistline, cardiovascular disease risk than wine
Anton Bannov // Shutterstock
2020 alcohol-related death stats:
- 126 deaths (up 231.6% from 2000)
- 20.2 deaths per 100,000 people (up 225.8% from 2000)
- 2020 state population: 623,347 (up 2.4% from 2000)
Anton Bannov // Shutterstock
2020 alcohol-related death stats:
- 126 deaths (up 231.6% from 2000)
- 20.2 deaths per 100,000 people (up 225.8% from 2000)
- 2020 state population: 623,347 (up 2.4% from 2000)
-
-
Beer and spirits have more detrimental effects on the waistline, cardiovascular disease risk than wine
View Apart // Shutterstock
2020 alcohol-related death stats:
- 996 deaths (up 178.2% from 2000)
- 11.6 deaths per 100,000 people (up 127.5% from 2000)
- 2020 state population: 8,590,563 (up 21.4% from 2000)
View Apart // Shutterstock
2020 alcohol-related death stats:
- 996 deaths (up 178.2% from 2000)
- 11.6 deaths per 100,000 people (up 127.5% from 2000)
- 2020 state population: 8,590,563 (up 21.4% from 2000)
-
Beer and spirits have more detrimental effects on the waistline, cardiovascular disease risk than wine
Colleen Michaels // Shutterstock
2020 alcohol-related death stats:
- 1,506 deaths (up 187.4% from 2000)
- 19.6 deaths per 100,000 people (up 120.2% from 2000)
- 2020 state population: 7,693,612 (up 30.5% from 2000)
Colleen Michaels // Shutterstock
2020 alcohol-related death stats:
- 1,506 deaths (up 187.4% from 2000)
- 19.6 deaths per 100,000 people (up 120.2% from 2000)
- 2020 state population: 7,693,612 (up 30.5% from 2000)
-
-
Beer and spirits have more detrimental effects on the waistline, cardiovascular disease risk than wine
bogdanhoda // Shutterstock
2020 alcohol-related death stats:
- 87 deaths (down 23.0% from 2000)
- 12.2 deaths per 100,000 people (down 38.4% from 2000)
bogdanhoda // Shutterstock
2020 alcohol-related death stats:
- 87 deaths (down 23.0% from 2000)
- 12.2 deaths per 100,000 people (down 38.4% from 2000)
-
Beer and spirits have more detrimental effects on the waistline, cardiovascular disease risk than wine
wavebreakmedia // Shutterstock
2020 alcohol-related death stats:
- 304 deaths (up 108.2% from 2000)
- 17.0 deaths per 100,000 people (up 109.9% from 2000)
- 2020 state population: 1,784,787 (down 1.3% from 2000)
wavebreakmedia // Shutterstock
2020 alcohol-related death stats:
- 304 deaths (up 108.2% from 2000)
- 17.0 deaths per 100,000 people (up 109.9% from 2000)
- 2020 state population: 1,784,787 (down 1.3% from 2000)
-
-
Beer and spirits have more detrimental effects on the waistline, cardiovascular disease risk than wine
tristan tan // Shutterstock
2020 alcohol-related death stats:
- 1,077 deaths (up 172.7% from 2000)
- 18.5 deaths per 100,000 people (up 150.0% from 2000)
- 2020 state population: 5,832,655 (up 8.7% from 2000)
tristan tan // Shutterstock
2020 alcohol-related death stats:
- 1,077 deaths (up 172.7% from 2000)
- 18.5 deaths per 100,000 people (up 150.0% from 2000)
- 2020 state population: 5,832,655 (up 8.7% from 2000)
-
Beer and spirits have more detrimental effects on the waistline, cardiovascular disease risk than wine
PrimePhoto // Shutterstock
2020 alcohol-related death stats:
- 227 deaths (up 254.7% from 2000)
- 39.0 deaths per 100,000 people (up 200.0% from 2000)
- 2020 state population: 582,328 (up 17.9% from 2000)
This story originally appeared on Zinnia Health and was produced and distributed in partnership with Stacker Studio.
-
-
A look at the prevalence of binge drinking by state
Canva
While having an occasional drink may seem harmless, there are undoubtedly consequences for drinking heavily. According to data from the U.S. Centers for Disease Control and Prevention (CDC), excessive alcohol consumption over time can lead to chronic health conditions such as high blood pressure, liver disease, cancer, and has even accounted for 95,000 deaths a year in the U.S.
The Community Preventive Services Task Force, an independent, nonfederal group of public health and prevention experts, has suggested several strategies for preventing excessive drinking. Some of these suggestions include raised alcohol taxation, regulating the number of alcohol outlets and availability, and enforcing laws preventing alcohol sales to minors.
Citing data released by the CDC in October 2021 based on a May 2018 survey, Zinnia Health identified rates of binge drinking across the U.S. Binge drinking is defined as four or more drinks on one occasion for women and five or more for men. The research only surveyed people who binge drank in the past 30 days. The CDC definition does not encompass what qualifies as binge drinking for trans or nonbinary individuals.
-
A look at the prevalence of binge drinking by state
Canva
- Median times respondents binge drank in the past month: 1.7
--- Among top 10% of binge drinkers: 8.4
- Median number of drinks: 5.5
--- Among top 10% of binge drinkers: 10.8
Canva
- Median times respondents binge drank in the past month: 1.7
--- Among top 10% of binge drinkers: 8.4
- Median number of drinks: 5.5
--- Among top 10% of binge drinkers: 10.8
-
-
A look at the prevalence of binge drinking by state
Felipe Mahecha // Shutterstock
- Median times respondents binge drank in the past month: 1.9
--- Among top 10% of binge drinkers: 9.6
- Median number of drinks: 5.4
--- Among top 10% of binge drinkers: 9.6
Felipe Mahecha // Shutterstock
- Median times respondents binge drank in the past month: 1.9
--- Among top 10% of binge drinkers: 9.6
- Median number of drinks: 5.4
--- Among top 10% of binge drinkers: 9.6
-
A look at the prevalence of binge drinking by state
Canva
- Median times respondents binge drank in the past month: 1.5
--- Among top 10% of binge drinkers: 9.2
- Median number of drinks: 5.5
--- Among top 10% of binge drinkers: 11.3
Canva
- Median times respondents binge drank in the past month: 1.5
--- Among top 10% of binge drinkers: 9.2
- Median number of drinks: 5.5
--- Among top 10% of binge drinkers: 11.3
-
-
A look at the prevalence of binge drinking by state
Sean Pavone // Shutterstock
- Median times respondents binge drank in the past month: 1.9
--- Among top 10% of binge drinkers: 11.2
- Median number of drinks: 5.6
--- Among top 10% of binge drinkers: 11.8
Sean Pavone // Shutterstock
- Median times respondents binge drank in the past month: 1.9
--- Among top 10% of binge drinkers: 11.2
- Median number of drinks: 5.6
--- Among top 10% of binge drinkers: 11.8
-
A look at the prevalence of binge drinking by state
PTZ Pictures // Shutterstock
- Median times respondents binge drank in the past month: 1.6
--- Among top 10% of binge drinkers: 7.9
- Median number of drinks: 5.5
--- Among top 10% of binge drinkers: 11.5
PTZ Pictures // Shutterstock
- Median times respondents binge drank in the past month: 1.6
--- Among top 10% of binge drinkers: 7.9
- Median number of drinks: 5.5
--- Among top 10% of binge drinkers: 11.5
-
-
A look at the prevalence of binge drinking by state
Canva
- Median times respondents binge drank in the past month: 1.6
--- Among top 10% of binge drinkers: 9.1
- Median number of drinks: 5.6
--- Among top 10% of binge drinkers: 11.4
Canva
- Median times respondents binge drank in the past month: 1.6
--- Among top 10% of binge drinkers: 9.1
- Median number of drinks: 5.6
--- Among top 10% of binge drinkers: 11.4
-
A look at the prevalence of binge drinking by state
Canva
- Median times respondents binge drank in the past month: 1.6
--- Among top 10% of binge drinkers: 7.8
- Median number of drinks: 5.2
--- Among top 10% of binge drinkers: 9.3
Canva
- Median times respondents binge drank in the past month: 1.6
--- Among top 10% of binge drinkers: 7.8
- Median number of drinks: 5.2
--- Among top 10% of binge drinkers: 9.3
-
-
A look at the prevalence of binge drinking by state
DavidNNP // Shutterstock
- Median times respondents binge drank in the past month: 1.5
--- Among top 10% of binge drinkers: 6.9
- Median number of drinks: 5.2
--- Among top 10% of binge drinkers: 9.4
DavidNNP // Shutterstock
- Median times respondents binge drank in the past month: 1.5
--- Among top 10% of binge drinkers: 6.9
- Median number of drinks: 5.2
--- Among top 10% of binge drinkers: 9.4
-
A look at the prevalence of binge drinking by state
Canva
- Median times respondents binge drank in the past month: 1.7
--- Among top 10% of binge drinkers: 11.3
- Median number of drinks: 5.3
--- Among top 10% of binge drinkers: 11.3
Canva
- Median times respondents binge drank in the past month: 1.7
--- Among top 10% of binge drinkers: 11.3
- Median number of drinks: 5.3
--- Among top 10% of binge drinkers: 11.3
-
-
A look at the prevalence of binge drinking by state
fotomak // Shutterstock
- Median times respondents binge drank in the past month: 1.8
--- Among top 10% of binge drinkers: 14.2
- Median number of drinks: 5.5
--- Among top 10% of binge drinkers: 11.1
fotomak // Shutterstock
- Median times respondents binge drank in the past month: 1.8
--- Among top 10% of binge drinkers: 14.2
- Median number of drinks: 5.5
--- Among top 10% of binge drinkers: 11.1
-
A look at the prevalence of binge drinking by state
Canva
- Median times respondents binge drank in the past month: 1.6
--- Among top 10% of binge drinkers: 9.7
- Median number of drinks: 5.3
--- Among top 10% of binge drinkers: 11.5
Canva
- Median times respondents binge drank in the past month: 1.6
--- Among top 10% of binge drinkers: 9.7
- Median number of drinks: 5.3
--- Among top 10% of binge drinkers: 11.5
-
-
A look at the prevalence of binge drinking by state
Canva
- Median times respondents binge drank in the past month: 1.9
--- Among top 10% of binge drinkers: 11.1
- Median number of drinks: 5.7
--- Among top 10% of binge drinkers: 13.3
Canva
- Median times respondents binge drank in the past month: 1.9
--- Among top 10% of binge drinkers: 11.1
- Median number of drinks: 5.7
--- Among top 10% of binge drinkers: 13.3
-
A look at the prevalence of binge drinking by state
Canva
- Median times respondents binge drank in the past month: 2
--- Among top 10% of binge drinkers: 10.5
- Median number of drinks: 5.8
--- Among top 10% of binge drinkers: 13.1
Canva
- Median times respondents binge drank in the past month: 2
--- Among top 10% of binge drinkers: 10.5
- Median number of drinks: 5.8
--- Among top 10% of binge drinkers: 13.1
-
-
A look at the prevalence of binge drinking by state
Conchi Martinez // Shutterstock
- Median times respondents binge drank in the past month: 1.9
--- Among top 10% of binge drinkers: 9.7
- Median number of drinks: 5.7
--- Among top 10% of binge drinkers: 14
Conchi Martinez // Shutterstock
- Median times respondents binge drank in the past month: 1.9
--- Among top 10% of binge drinkers: 9.7
- Median number of drinks: 5.7
--- Among top 10% of binge drinkers: 14
-
A look at the prevalence of binge drinking by state
Canva
- Median times respondents binge drank in the past month: 1.7
--- Among top 10% of binge drinkers: 9.9
- Median number of drinks: 5.6
--- Among top 10% of binge drinkers: 14.1
Canva
- Median times respondents binge drank in the past month: 1.7
--- Among top 10% of binge drinkers: 9.9
- Median number of drinks: 5.6
--- Among top 10% of binge drinkers: 14.1
-
-
A look at the prevalence of binge drinking by state
Canva
- Median times respondents binge drank in the past month: 1.9
--- Among top 10% of binge drinkers: 9.5
- Median number of drinks: 5.8
--- Among top 10% of binge drinkers: 11.9
Canva
- Median times respondents binge drank in the past month: 1.9
--- Among top 10% of binge drinkers: 9.5
- Median number of drinks: 5.8
--- Among top 10% of binge drinkers: 11.9
-
A look at the prevalence of binge drinking by state
Canva
- Median times respondents binge drank in the past month: 1.6
--- Among top 10% of binge drinkers: 8.6
- Median number of drinks: 5.6
--- Among top 10% of binge drinkers: 11.5
Canva
- Median times respondents binge drank in the past month: 1.6
--- Among top 10% of binge drinkers: 8.6
- Median number of drinks: 5.6
--- Among top 10% of binge drinkers: 11.5
-
-
A look at the prevalence of binge drinking by state
f11photo // Shutterstock
- Median times respondents binge drank in the past month: 1.9
--- Among top 10% of binge drinkers: 10.2
- Median number of drinks: 5.7
--- Among top 10% of binge drinkers: 13.7
f11photo // Shutterstock
- Median times respondents binge drank in the past month: 1.9
--- Among top 10% of binge drinkers: 10.2
- Median number of drinks: 5.7
--- Among top 10% of binge drinkers: 13.7
-
A look at the prevalence of binge drinking by state
f11photo // Shutterstock
- Median times respondents binge drank in the past month: 2
--- Among top 10% of binge drinkers: 9.9
- Median number of drinks: 5.5
--- Among top 10% of binge drinkers: 11.3
f11photo // Shutterstock
- Median times respondents binge drank in the past month: 2
--- Among top 10% of binge drinkers: 9.9
- Median number of drinks: 5.5
--- Among top 10% of binge drinkers: 11.3
-
-
A look at the prevalence of binge drinking by state
Canva
- Median times respondents binge drank in the past month: 1.8
--- Among top 10% of binge drinkers: 9.3
- Median number of drinks: 5.4
--- Among top 10% of binge drinkers: 11.2
Canva
- Median times respondents binge drank in the past month: 1.8
--- Among top 10% of binge drinkers: 9.3
- Median number of drinks: 5.4
--- Among top 10% of binge drinkers: 11.2
-
A look at the prevalence of binge drinking by state
Canva
- Median times respondents binge drank in the past month: 1.6
--- Among top 10% of binge drinkers: 7.9
- Median number of drinks: 5.3
--- Among top 10% of binge drinkers: 10
Canva
- Median times respondents binge drank in the past month: 1.6
--- Among top 10% of binge drinkers: 7.9
- Median number of drinks: 5.3
--- Among top 10% of binge drinkers: 10
-
-
A look at the prevalence of binge drinking by state
Canva
- Median times respondents binge drank in the past month: 1.5
--- Among top 10% of binge drinkers: 7
- Median number of drinks: 5.4
--- Among top 10% of binge drinkers: 11.2
Canva
- Median times respondents binge drank in the past month: 1.5
--- Among top 10% of binge drinkers: 7
- Median number of drinks: 5.4
--- Among top 10% of binge drinkers: 11.2
-
A look at the prevalence of binge drinking by state
Belikova Oksana // Shutterstock
- Median times respondents binge drank in the past month: 1.8
--- Among top 10% of binge drinkers: 10
- Median number of drinks: 5.6
--- Among top 10% of binge drinkers: 11.7
Belikova Oksana // Shutterstock
- Median times respondents binge drank in the past month: 1.8
--- Among top 10% of binge drinkers: 10
- Median number of drinks: 5.6
--- Among top 10% of binge drinkers: 11.7
-
-
A look at the prevalence of binge drinking by state
Canva
- Median times respondents binge drank in the past month: 1.5
--- Among top 10% of binge drinkers: 9.1
- Median number of drinks: 5.5
--- Among top 10% of binge drinkers: 11.3
Canva
- Median times respondents binge drank in the past month: 1.5
--- Among top 10% of binge drinkers: 9.1
- Median number of drinks: 5.5
--- Among top 10% of binge drinkers: 11.3
-
A look at the prevalence of binge drinking by state
Canva
- Median times respondents binge drank in the past month: 2.1
--- Among top 10% of binge drinkers: 14.8
- Median number of drinks: 5.7
--- Among top 10% of binge drinkers: 14.6
Canva
- Median times respondents binge drank in the past month: 2.1
--- Among top 10% of binge drinkers: 14.8
- Median number of drinks: 5.7
--- Among top 10% of binge drinkers: 14.6
-
-
A look at the prevalence of binge drinking by state
RozenskiP // Shutterstock
- Median times respondents binge drank in the past month: 1.8
--- Among top 10% of binge drinkers: 14
- Median number of drinks: 5.5
--- Among top 10% of binge drinkers: 11.7
RozenskiP // Shutterstock
- Median times respondents binge drank in the past month: 1.8
--- Among top 10% of binge drinkers: 14
- Median number of drinks: 5.5
--- Among top 10% of binge drinkers: 11.7
-
A look at the prevalence of binge drinking by state
Canva
- Median times respondents binge drank in the past month: 1.6
--- Among top 10% of binge drinkers: 9.1
- Median number of drinks: 5.4
--- Among top 10% of binge drinkers: 10.4
Canva
- Median times respondents binge drank in the past month: 1.6
--- Among top 10% of binge drinkers: 9.1
- Median number of drinks: 5.4
--- Among top 10% of binge drinkers: 10.4
-
-
A look at the prevalence of binge drinking by state
Shots by Natalie // Shutterstock
- Median times respondents binge drank in the past month: 1.7
--- Among top 10% of binge drinkers: 9.1
- Median number of drinks: 5.6
--- Among top 10% of binge drinkers: 11.4
Shots by Natalie // Shutterstock
- Median times respondents binge drank in the past month: 1.7
--- Among top 10% of binge drinkers: 9.1
- Median number of drinks: 5.6
--- Among top 10% of binge drinkers: 11.4
-
A look at the prevalence of binge drinking by state
Benny Marty // Shutterstock
- Median times respondents binge drank in the past month: 1.6
--- Among top 10% of binge drinkers: 7.4
- Median number of drinks: 5.5
--- Among top 10% of binge drinkers: 11.2
Benny Marty // Shutterstock
- Median times respondents binge drank in the past month: 1.6
--- Among top 10% of binge drinkers: 7.4
- Median number of drinks: 5.5
--- Among top 10% of binge drinkers: 11.2
-
-
A look at the prevalence of binge drinking by state
Canva
- Median times respondents binge drank in the past month: 1.5
--- Among top 10% of binge drinkers: 9.9
- Median number of drinks: 5.5
--- Among top 10% of binge drinkers: 11.2
Canva
- Median times respondents binge drank in the past month: 1.5
--- Among top 10% of binge drinkers: 9.9
- Median number of drinks: 5.5
--- Among top 10% of binge drinkers: 11.2
-
A look at the prevalence of binge drinking by state
Racheal Grazias // Shutterstock
- Median times respondents binge drank in the past month: Estimates considered unreliable
--- Among top 10% of binge drinkers: 7.2
- Median number of drinks: 5.2
--- Among top 10% of binge drinkers: 9.7
Racheal Grazias // Shutterstock
- Median times respondents binge drank in the past month: Estimates considered unreliable
--- Among top 10% of binge drinkers: 7.2
- Median number of drinks: 5.2
--- Among top 10% of binge drinkers: 9.7
-
-
A look at the prevalence of binge drinking by state
Canva
- Median times respondents binge drank in the past month: 1.8
--- Among top 10% of binge drinkers: 11.4
- Median number of drinks: 5.5
--- Among top 10% of binge drinkers: 13.1
Canva
- Median times respondents binge drank in the past month: 1.8
--- Among top 10% of binge drinkers: 11.4
- Median number of drinks: 5.5
--- Among top 10% of binge drinkers: 13.1
-
A look at the prevalence of binge drinking by state
Luke W. Choi // Shutterstock
- Median times respondents binge drank in the past month: 1.6
--- Among top 10% of binge drinkers: 7.7
- Median number of drinks: 5.4
--- Among top 10% of binge drinkers: 11
Luke W. Choi // Shutterstock
- Median times respondents binge drank in the past month: 1.6
--- Among top 10% of binge drinkers: 7.7
- Median number of drinks: 5.4
--- Among top 10% of binge drinkers: 11
-
-
A look at the prevalence of binge drinking by state
Canva
- Median times respondents binge drank in the past month: 1.8
--- Among top 10% of binge drinkers: 10.7
- Median number of drinks: 5.4
--- Among top 10% of binge drinkers: 10.5
Canva
- Median times respondents binge drank in the past month: 1.8
--- Among top 10% of binge drinkers: 10.7
- Median number of drinks: 5.4
--- Among top 10% of binge drinkers: 10.5
-
A look at the prevalence of binge drinking by state
Canva
- Median times respondents binge drank in the past month: 1.8
--- Among top 10% of binge drinkers: 8.2
- Median number of drinks: 5.9
--- Among top 10% of binge drinkers: 14.1
Canva
- Median times respondents binge drank in the past month: 1.8
--- Among top 10% of binge drinkers: 8.2
- Median number of drinks: 5.9
--- Among top 10% of binge drinkers: 14.1
-
-
A look at the prevalence of binge drinking by state
Canva
- Median times respondents binge drank in the past month: 1.9
--- Among top 10% of binge drinkers: 12
- Median number of drinks: 5.7
--- Among top 10% of binge drinkers: 11.8
Canva
- Median times respondents binge drank in the past month: 1.9
--- Among top 10% of binge drinkers: 12
- Median number of drinks: 5.7
--- Among top 10% of binge drinkers: 11.8
-
A look at the prevalence of binge drinking by state
Canva
- Median times respondents binge drank in the past month: 1.5
--- Among top 10% of binge drinkers: 9.3
- Median number of drinks: 5.6
--- Among top 10% of binge drinkers: 11.5
Canva
- Median times respondents binge drank in the past month: 1.5
--- Among top 10% of binge drinkers: 9.3
- Median number of drinks: 5.6
--- Among top 10% of binge drinkers: 11.5
-
-
A look at the prevalence of binge drinking by state
photomatz // Shutterstock
- Median times respondents binge drank in the past month: 1.7
--- Among top 10% of binge drinkers: 9.6
- Median number of drinks: 5.5
--- Among top 10% of binge drinkers: 9.9
photomatz // Shutterstock
- Median times respondents binge drank in the past month: 1.7
--- Among top 10% of binge drinkers: 9.6
- Median number of drinks: 5.5
--- Among top 10% of binge drinkers: 9.9
-
A look at the prevalence of binge drinking by state
Canva
- Median times respondents binge drank in the past month: 1.8
--- Among top 10% of binge drinkers: 7.9
- Median number of drinks: 5.5
--- Among top 10% of binge drinkers: 11.5
Canva
- Median times respondents binge drank in the past month: 1.8
--- Among top 10% of binge drinkers: 7.9
- Median number of drinks: 5.5
--- Among top 10% of binge drinkers: 11.5
-
-
A look at the prevalence of binge drinking by state
James Kirkikis // Shutterstock
- Median times respondents binge drank in the past month: 1.6
--- Among top 10% of binge drinkers: 8.5
- Median number of drinks: 5.4
--- Among top 10% of binge drinkers: 9.7
James Kirkikis // Shutterstock
- Median times respondents binge drank in the past month: 1.6
--- Among top 10% of binge drinkers: 8.5
- Median number of drinks: 5.4
--- Among top 10% of binge drinkers: 9.7
-
A look at the prevalence of binge drinking by state
Canva
- Median times respondents binge drank in the past month: 1.9
--- Among top 10% of binge drinkers: 11.4
- Median number of drinks: 5.7
--- Among top 10% of binge drinkers: 11.7
Canva
- Median times respondents binge drank in the past month: 1.9
--- Among top 10% of binge drinkers: 11.4
- Median number of drinks: 5.7
--- Among top 10% of binge drinkers: 11.7
-
-
A look at the prevalence of binge drinking by state
James Gabbert // Shutterstock
- Median times respondents binge drank in the past month: 1.7
--- Among top 10% of binge drinkers: 7.8
- Median number of drinks: 5.7
--- Among top 10% of binge drinkers: 11.6
James Gabbert // Shutterstock
- Median times respondents binge drank in the past month: 1.7
--- Among top 10% of binge drinkers: 7.8
- Median number of drinks: 5.7
--- Among top 10% of binge drinkers: 11.6
-
A look at the prevalence of binge drinking by state
Sean Pavone // Shutterstock
- Median times respondents binge drank in the past month: 1.7
--- Among top 10% of binge drinkers: 9.2
- Median number of drinks: 5.5
--- Among top 10% of binge drinkers: 11.8
Sean Pavone // Shutterstock
- Median times respondents binge drank in the past month: 1.7
--- Among top 10% of binge drinkers: 9.2
- Median number of drinks: 5.5
--- Among top 10% of binge drinkers: 11.8
-
-
A look at the prevalence of binge drinking by state
f11photo // Shutterstock
- Median times respondents binge drank in the past month: 1.8
--- Among top 10% of binge drinkers: 9.9
- Median number of drinks: 5.6
--- Among top 10% of binge drinkers: 11.7
f11photo // Shutterstock
- Median times respondents binge drank in the past month: 1.8
--- Among top 10% of binge drinkers: 9.9
- Median number of drinks: 5.6
--- Among top 10% of binge drinkers: 11.7
-
A look at the prevalence of binge drinking by state
Canva
- Median times respondents binge drank in the past month: 1.7
--- Among top 10% of binge drinkers: 10.2
- Median number of drinks: 5.6
--- Among top 10% of binge drinkers: 11.4
Canva
- Median times respondents binge drank in the past month: 1.7
--- Among top 10% of binge drinkers: 10.2
- Median number of drinks: 5.6
--- Among top 10% of binge drinkers: 11.4
-
-
A look at the prevalence of binge drinking by state
Canva
- Median times respondents binge drank in the past month: 1.9
--- Among top 10% of binge drinkers: 9.5
- Median number of drinks: 5.5
--- Among top 10% of binge drinkers: 10.6
Canva
- Median times respondents binge drank in the past month: 1.9
--- Among top 10% of binge drinkers: 9.5
- Median number of drinks: 5.5
--- Among top 10% of binge drinkers: 10.6
-
A look at the prevalence of binge drinking by state
Canva
- Median times respondents binge drank in the past month: 1.6
--- Among top 10% of binge drinkers: 9.8
- Median number of drinks: 5.5
--- Among top 10% of binge drinkers: 11.3
Canva
- Median times respondents binge drank in the past month: 1.6
--- Among top 10% of binge drinkers: 9.8
- Median number of drinks: 5.5
--- Among top 10% of binge drinkers: 11.3
-
-
A look at the prevalence of binge drinking by state
Jay Yuan // Shutterstock
- Median times respondents binge drank in the past month: 1.5
--- Among top 10% of binge drinkers: 9.2
- Median number of drinks: 5.3
--- Among top 10% of binge drinkers: 9.9
Jay Yuan // Shutterstock
- Median times respondents binge drank in the past month: 1.5
--- Among top 10% of binge drinkers: 9.2
- Median number of drinks: 5.3
--- Among top 10% of binge drinkers: 9.9
-
A look at the prevalence of binge drinking by state
Canva
- Median times respondents binge drank in the past month: 1.8
--- Among top 10% of binge drinkers: 15.2
- Median number of drinks: 6.4
--- Among top 10% of binge drinkers: 14.6
Canva
- Median times respondents binge drank in the past month: 1.8
--- Among top 10% of binge drinkers: 15.2
- Median number of drinks: 6.4
--- Among top 10% of binge drinkers: 14.6
-
-
A look at the prevalence of binge drinking by state
Canva
- Median times respondents binge drank in the past month: 1.7
--- Among top 10% of binge drinkers: 9.1
- Median number of drinks: 5.5
--- Among top 10% of binge drinkers: 10.8
Canva
- Median times respondents binge drank in the past month: 1.7
--- Among top 10% of binge drinkers: 9.1
- Median number of drinks: 5.5
--- Among top 10% of binge drinkers: 10.8
-
A look at the prevalence of binge drinking by state
Jacob Boomsma // Shutterstock
- Median times respondents binge drank in the past month: 1.5
--- Among top 10% of binge drinkers: 10.4
- Median number of drinks: 5.5
--- Among top 10% of binge drinkers: 11.6
This story originally appeared on Zinnia Health and was produced and distributed in partnership with Stacker Studio.
